
GeoPing | Multi-Location IP Availability & Latency Check
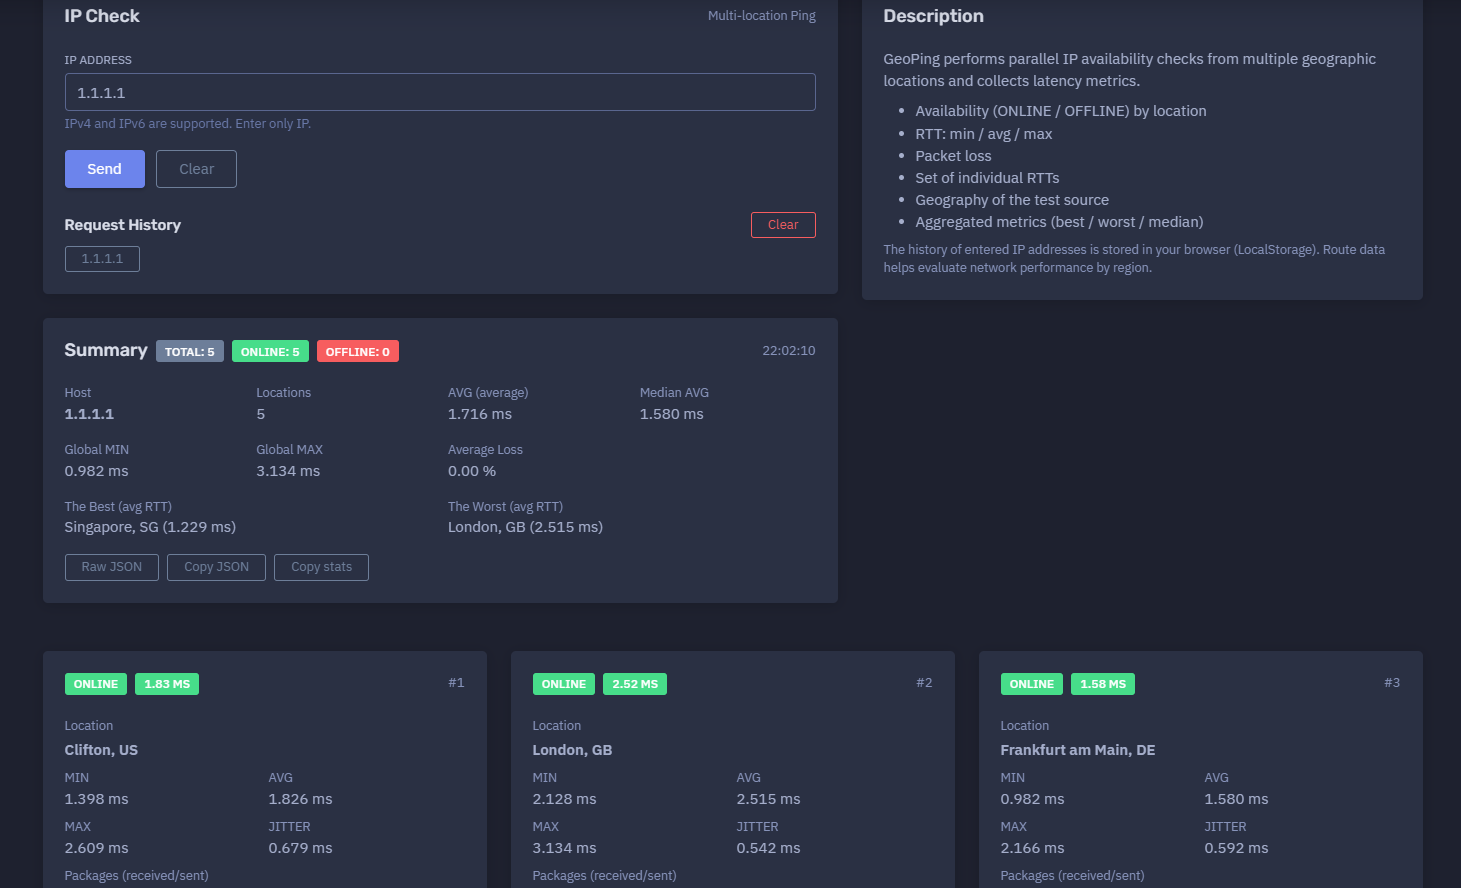
The platform available at https://dash.niamonx.io/geoping — known as GeoPing — is a multi-location network diagnostic tool within the NiamonX platform. It allows users to check IPv4 and IPv6 availability from several geographic locations at the same time and compare latency, packet loss, jitter, and route quality by region.
Overview of the Service
GeoPing is designed to help users understand how reachable and responsive an IP address is from different parts of the world.
Unlike a single-location ping test, GeoPing performs parallel checks from multiple geographic nodes and aggregates the results into a structured report. This makes it useful for identifying regional connectivity differences, routing problems, CDN behavior, network instability, and global availability issues.
The tool is intended for network engineers, DevOps teams, SOC analysts, system administrators, infrastructure owners, hosting providers, cybersecurity teams, and technical users who need to evaluate IP-level connectivity from several locations.
GeoPing supports:
-
IPv4 addresses
-
IPv6 addresses
-
Multi-location availability checks
-
Regional RTT comparison
-
Packet loss analysis
-
Jitter measurement
-
Best / worst location detection
-
Median and average latency metrics
-
Local browser-based request history
The tool accepts only IP addresses. Domains, URLs, ports, and paths are not supported in this module.
🔍 How the Tool Works
When a user enters an IPv4 or IPv6 address, GeoPing launches parallel availability checks from several geographic locations.
Each location sends multiple network echo requests to the target IP. The tool then calculates per-location metrics and global aggregated statistics.
The result includes:
-
Overall number of test locations
-
Number of online locations
-
Number of offline locations
-
Average RTT across locations
-
Median average RTT
-
Global minimum RTT
-
Global maximum RTT
-
Average packet loss
-
Best location by average RTT
-
Worst location by average RTT
-
Per-location availability status
-
Per-location minimum, average, and maximum RTT
-
Per-location jitter
-
Packets received / sent
-
Packet loss percentage
-
Individual RTT values
Example summary:
Total: 5
ONLINE: 5
OFFLINE: 0
Host: 1.1.1.1
Locations: 5
AVG: 1.716 ms
Median AVG: 1.580 ms
Global MIN: 0.982 ms
Global MAX: 3.134 ms
Average Loss: 0.00%
Best: Singapore, SG
Worst: London, GB
This allows users to quickly understand whether the IP is globally reachable and whether any region has unusual latency or packet loss.
🧩 What Can Be Checked
GeoPing supports direct IP address checks.
Supported input types:
-
IPv4 address
-
IPv6 address
Valid examples:
1.1.1.1
8.8.8.8
2606:4700:4700::1111
Unsupported input examples:
example.com
https://example.com
1.1.1.1:443
example.com/path
GeoPing expects only a clean IPv4 or IPv6 address.
⚙️ Check Interface
The GeoPing interface contains a simple input field and result sections.
IP Address
The user enters the target IP address.
Example:
1.1.1.1
The interface indicates that IPv4 and IPv6 are supported and that only an IP address should be entered.
After the request is processed, the tool displays:
-
Summary block
-
Per-location result cards
-
Individual RTT lists
-
Packet loss values
-
Request history
📊 Summary Section
The Summary section provides a global view of the test.
Typical fields include:
| Field | Description |
|---|---|
| Total | Total number of locations used for the test |
| ONLINE | Number of locations where the IP responded |
| OFFLINE | Number of locations where the IP did not respond |
| Host | Checked IP address |
| Locations | Number of geographic test sources |
| AVG | Average latency across test locations |
| Median AVG | Median of per-location average RTT values |
| Global MIN | Lowest RTT measured across all packets and locations |
| Global MAX | Highest RTT measured across all packets and locations |
| Average Loss | Average packet loss across all locations |
| Best | Location with the lowest average RTT |
| Worst | Location with the highest average RTT |
Example:
ONLINE: 5
OFFLINE: 0
AVG: 1.716 ms
Average Loss: 0.00%
Best: Singapore, SG
Worst: London, GB
This block helps users quickly identify whether the target is reachable globally and which regions have the best or worst connectivity.
🌍 Multi-Location Testing
GeoPing runs checks from multiple geographic locations.
Example locations may include:
-
Clifton, US
-
London, GB
-
Frankfurt am Main, DE
-
Amsterdam, NL
-
Singapore, SG
Each location has its own result card showing availability and latency metrics.
This is useful because network performance can vary significantly by region.
For example:
-
A target may be fast from Europe but slow from Asia.
-
A CDN or anycast IP may route each region to a nearby node.
-
A firewall may allow traffic from one region but block another.
-
A routing issue may affect only one geography.
-
A hosting provider may have regional packet loss.
✅ Availability Status
Each location returns an availability status.
Common statuses:
| Status | Meaning |
|---|---|
| ONLINE | The IP responded from that location |
| OFFLINE | No response was received from that location |
| UNKNOWN | The result could not be confidently determined |
Example:
ONLINE
1.83 ms
Location: Clifton, US
If the IP is online from some regions and offline from others, this may indicate routing filters, regional firewall rules, DDoS protection behavior, provider issues, or temporary network problems.
⏱️ RTT Metrics
RTT means Round-Trip Time. It measures how long a packet takes to travel from the test location to the target IP and back.
Each location card may include:
-
MIN RTT
-
AVG RTT
-
MAX RTT
-
JITTER
-
RTT list
Example:
Location: Frankfurt am Main, DE
MIN: 0.982 ms
AVG: 1.580 ms
MAX: 2.166 ms
JITTER: 0.592 ms
Packets: 3/3
Losses: 0%
Minimum RTT
The fastest response observed from that location.
Average RTT
The average response time from that location.
Maximum RTT
The slowest response observed from that location.
RTT List
The individual response times for each packet.
Example:
RTT list: 1.250, 1.188, 1.250
📉 Jitter
Jitter measures the variation between individual RTT values.
Low jitter means the connection is stable.
High jitter may indicate:
-
Network congestion
-
Routing instability
-
Provider-level issues
-
Packet scheduling delays
-
Wireless or last-mile problems
-
Intercontinental routing instability
-
Saturated links
-
Temporary packet queuing
Example:
JITTER: 0.036 ms
A low jitter value is especially important for real-time applications such as VoIP, video calls, gaming, streaming, remote desktops, and interactive services.
📦 Packet Loss
Packet loss shows how many requests failed compared to how many were sent.
Example:
Packages received/sent: 3/3
Losses: 0%
Packet loss interpretation:
| Packet Loss | Meaning |
|---|---|
| 0% | Excellent delivery |
| 1–2% | Minor loss, usually acceptable but should be monitored |
| 3–5% | Noticeable instability |
| 5–10% | Significant network problem |
| 10%+ | Severe connectivity issue |
Packet loss from one region but not others may indicate a regional routing problem or filtering issue.
🏆 Best and Worst Locations
GeoPing automatically identifies the best and worst locations by average RTT.
Example:
The Best: Singapore, SG (1.229 ms)
The Worst: London, GB (2.515 ms)
Best Location
The location with the lowest average RTT.
This usually indicates the shortest or most efficient route from the test source to the target.
Worst Location
The location with the highest average RTT.
This may indicate longer routing distance, less efficient routing, congestion, filtering, or provider-level latency.
The best and worst labels are comparative within the current test, not absolute judgments of the target infrastructure.
📊 Aggregated Metrics
GeoPing includes global aggregated metrics across all locations.
Global Average
Shows the overall average latency across test sources.
Median Average
Shows the median of per-location average RTT values.
Median is useful because it is less affected by one unusually slow or fast location.
Global Minimum
Shows the fastest observed response from all locations.
Global Maximum
Shows the slowest observed response from all locations.
Average Loss
Shows the average packet loss across all test locations.
These metrics help users understand global route quality at a glance.
🧠 Latency Interpretation
Latency depends on geography, routing, peering, infrastructure, congestion, and target configuration.
General RTT interpretation:
| Average RTT | Interpretation |
|---|---|
| 0–20 ms | Very low latency |
| 20–60 ms | Good latency |
| 60–120 ms | Moderate latency |
| 120–250 ms | High latency |
| 250–300+ ms | Very high latency, often intercontinental or problematic |
| Timeout | No response, filtering, or target unavailable |
Important: low latency from multiple regions may indicate anycast routing, CDN edge infrastructure, or globally distributed network design.
High latency from one region may not mean the target is down. It may simply reflect distance, routing path, or provider differences.
🛰️ Anycast and CDN Interpretation
GeoPing is especially useful for checking anycast and CDN-style infrastructure.
For anycast services, the same IP address can be routed to different physical or logical locations depending on where the request originates.
This can explain why an IP may show very low latency from multiple regions at the same time.
Possible interpretations:
-
Anycast routing is working efficiently.
-
CDN edge nodes are close to the test sources.
-
DNS resolver or public service infrastructure is distributed.
-
Each region may reach a different backend node.
-
One region may be affected by routing or peering issues while others are healthy.
GeoPing does not prove the exact physical destination server. It shows observed connectivity from each test source.
🕓 Request History
GeoPing stores entered IP addresses in the user’s browser through LocalStorage.
Important behavior:
The history of entered IP addresses is stored in your browser.
History may include:
-
Checked IP address
-
Timestamp
-
Summary status
-
Average RTT
-
Best / worst locations
-
Packet loss values
The history is local to the browser and may be cleared when the user deletes browser data, switches devices, or uses another browser profile.
🧠 Key Features
Multi-Location Ping
Checks the same IP address from multiple geographic test sources.
IPv4 and IPv6 Support
Supports both IPv4 and IPv6 targets.
Parallel Availability Checks
Runs availability checks across several regions.
Per-Location Results
Each location shows status, RTT metrics, jitter, packets, loss, and RTT list.
Aggregated Summary
Shows global metrics such as average RTT, median, global min, global max, and average loss.
Best / Worst Location Detection
Automatically identifies the fastest and slowest test locations by average RTT.
Packet Loss Analysis
Displays packet loss per location and average loss globally.
Jitter Measurement
Shows latency stability for each geographic source.
Local History
Stores entered IPs locally in the browser.
Regional Route Insight
Helps compare network performance by geography.
✅ Recommended Diagnostic Workflow
A practical GeoPing workflow should follow these steps.
1. Enter the IP Address
Use only IPv4 or IPv6. Do not enter domains, URLs, ports, or paths.
2. Review Global Summary
Check total locations, online count, offline count, average RTT, median RTT, and average packet loss.
3. Identify Best and Worst Locations
Compare the fastest and slowest regions.
4. Review Per-Location Cards
Check each location’s minimum, average, maximum RTT, jitter, and packet loss.
5. Look for Regional Problems
Identify locations with high RTT, high jitter, packet loss, or offline status.
6. Compare With Expected Geography
Consider whether the target is expected to be close to the fastest region.
7. Repeat if Needed
Run another check if the issue appears temporary or inconsistent.
8. Correlate With Other Tools
Use traceroute, HTTP checks, DNS checks, CDN monitoring, firewall logs, and provider status pages for deeper analysis.
9. Document Findings
Use the summary and per-location metrics in troubleshooting reports or incident notes.
10. Validate Critical Issues
Confirm important outages or routing problems with additional monitoring sources.
🔎 Common Use Cases
GeoPing can support many technical workflows.
Global Availability Check
Confirm whether an IP is reachable from multiple regions.
CDN and Anycast Testing
Check how an anycast IP behaves from different geographic sources.
Regional Routing Diagnostics
Identify whether latency or packet loss affects specific regions.
Incident Response
Quickly determine whether an outage is global or region-specific.
Hosting Provider Comparison
Compare responsiveness of infrastructure from different test locations.
Network Performance Review
Evaluate latency consistency and jitter across regions.
Firewall and Filtering Validation
Check whether an IP responds from some countries but not others.
SLA and Monitoring Support
Use multi-location metrics as supporting evidence for service-quality review.
⚠️ Result Interpretation Notes
GeoPing results should be interpreted carefully.
Important limitations:
-
Some hosts block echo requests.
-
Offline from one region does not always mean the service is down.
-
A host can serve HTTP traffic even if ping is blocked.
-
Firewalls may treat test locations differently.
-
Anycast IPs may route each location to a different node.
-
RTT depends on distance, routing, and provider peering.
-
Small packet samples provide a quick diagnostic snapshot, not long-term monitoring.
-
Local or regional congestion may affect results temporarily.
-
GeoPing does not identify the exact physical server behind an anycast IP.
For critical production systems, GeoPing should be combined with continuous monitoring and application-level checks.
🛡️ Security, Privacy & Responsible Use
GeoPing is intended for lawful network diagnostics and infrastructure monitoring.
Acceptable use cases include:
-
Checking your own servers
-
Testing authorized infrastructure
-
Reviewing regional availability
-
Diagnosing packet loss
-
Measuring latency and jitter
-
Supporting incident response
-
Monitoring CDN and anycast behavior
-
Validating firewall and routing behavior
-
Creating troubleshooting reports
Users should follow responsible use principles:
-
Do not use the tool to harass or overload third-party systems.
-
Do not repeatedly test targets without a legitimate reason.
-
Do not treat ping failure as proof of full service outage.
-
Do not use results as the only source for critical operational decisions.
-
Respect applicable laws and network policies.
-
Treat local history as potentially sensitive on shared devices.
⚙️ Technical Highlights
-
Multi-location IP ping tool
-
Available at
dash.niamonx.io/geoping -
Supports IPv4
-
Supports IPv6
-
IP-only input
-
No domains or URLs accepted
-
Parallel checks from multiple geographic locations
-
Availability status by location
-
Global ONLINE / OFFLINE summary
-
Minimum RTT per location
-
Average RTT per location
-
Maximum RTT per location
-
Jitter per location
-
Packets received / sent
-
Packet loss per location
-
Individual RTT list
-
Global average RTT
-
Median average RTT
-
Global minimum RTT
-
Global maximum RTT
-
Average packet loss
-
Best location by average RTT
-
Worst location by average RTT
-
Source geography display
-
LocalStorage request history
-
Suitable for network diagnostics, DevOps, SOC, incident response, CDN checks, and global availability monitoring
📌 Usage Hints
-
Enter only an IPv4 or IPv6 address.
-
Do not enter domains, URLs, ports, or paths.
-
Use the global summary to check overall availability.
-
Use per-location cards to identify regional issues.
-
Compare best and worst locations for route quality.
-
Check packet loss before judging reliability.
-
Check jitter to detect unstable latency.
-
High RTT may be normal for long-distance routing.
-
Offline from one region may indicate filtering, not full outage.
-
Repeat tests if the result is unexpected.
-
Use additional diagnostics for production incidents.
-
Local history is stored in the browser through LocalStorage.
📬 Contact Information
For technical, legal, abuse, privacy, or support-related inquiries, users can contact the NiamonX team directly:
support@niamonx.io — Technical Support
other@niamonx.io — General Inquiries
takedown@niamonx.io — Privacy or Data Removal Requests
legal@niamonx.io — Legal and Compliance Matters
Alternative contact channel:
🔗 Helpdesk: https://support.niamonx.io/
Summary
NiamonX GeoPing is a multi-location IP availability and latency diagnostic tool for IPv4 and IPv6 addresses. It performs parallel checks from several geographic locations and returns global availability, per-location RTT metrics, packet loss, jitter, individual response times, best and worst locations, median latency, and aggregated performance indicators.
The tool is designed for global availability checks, CDN and anycast validation, routing diagnostics, incident response, DevOps workflows, SOC triage, and infrastructure monitoring. Results should be treated as a regional network-performance snapshot and validated with additional diagnostics for critical decisions.