Navigate the Graph (Web App) Interface
The NiamonX Graph interface is structured into three primary sections:
Each section is designed to support large-scale graph investigations, enrichment workflows, and collaborative intelligence operations.
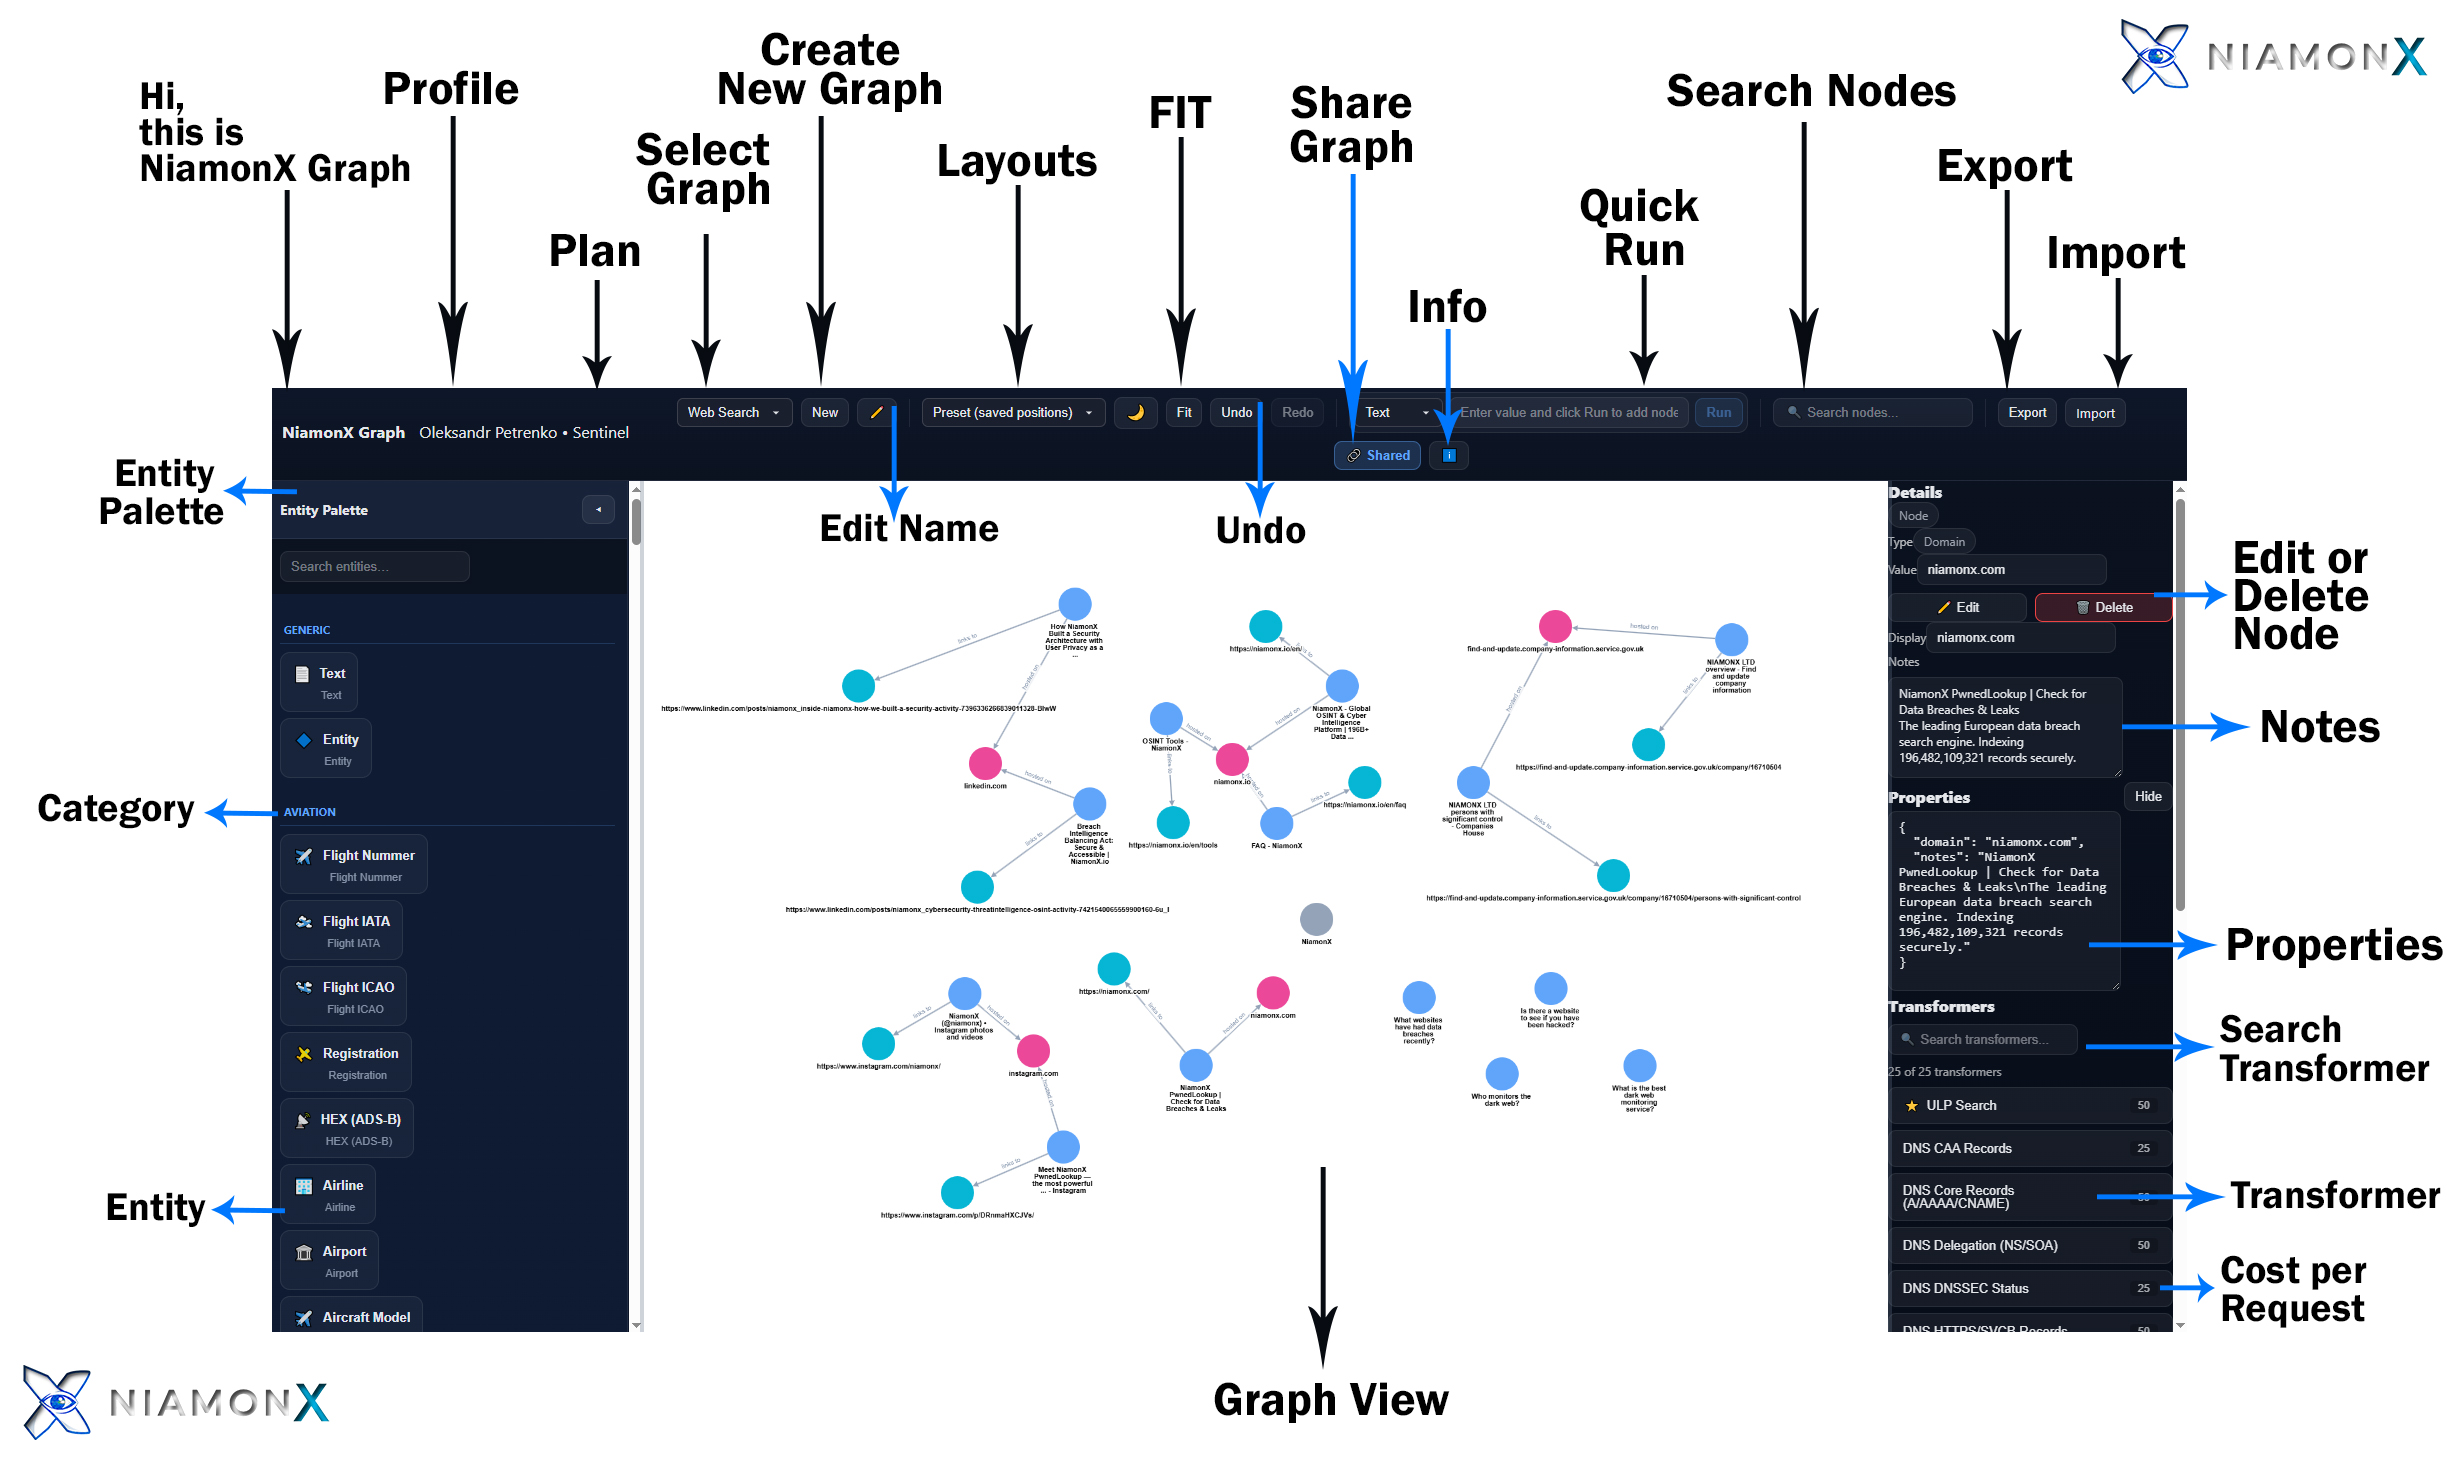
1. Top Navigation Bar
The top bar provides global controls for graph management, enrichment execution, collaboration, and navigation.
Identity & Workspace Area
• NiamonX Graph
Displays the active environment and current workspace.
• Profile
Shows the active user account and allows access to profile settings.
• Plan
Displays your current subscription tier and available capabilities.
Graph Management Controls
• Select Graph
Switch between saved graph workspaces.
• Create New Graph
Create a new blank investigation workspace.
• Edit Name
Rename the active graph workspace.
• Layouts
Apply automatic graph layout algorithms (e.g., force layout, hierarchical, radial) to optimize visualization.
• FIT
Automatically centers and scales the graph to fit the screen.
• Undo / Redo
Revert or reapply actions such as node creation, deletion, or transformer execution.
Intelligence Execution Controls
• Quick Run (Text Input + Run)
Enter a value (domain, email, IP, hash, etc.) and instantly create a node in the graph.
• Info
Displays contextual information about the current graph or selected node.
• Share Graph
Generate a secure public or restricted link to share your graph.
Supports:
-
Public read-only sharing
-
Controlled collaboration
-
Stakeholder presentation links
Search & Data Management
• Search Nodes
Search for nodes within the active graph.
• Export
Export graph data in supported formats (e.g., JSON, structured intelligence format).
• Import
Import previously exported graphs or structured intelligence datasets.
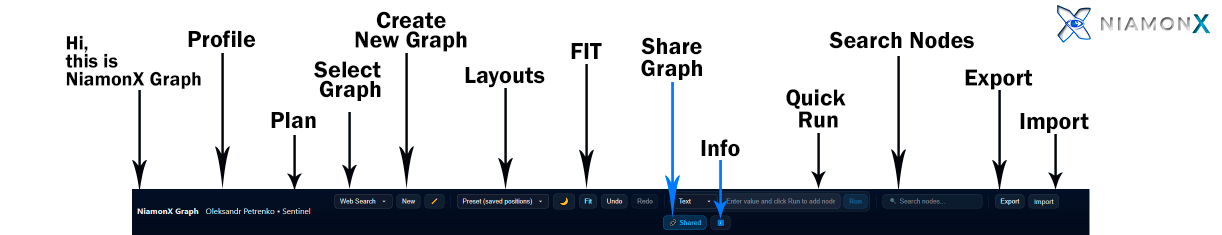
2. Entity Palette (Left Sidebar)
Entity Palette
Contains all available entity types grouped by categories.
Search Entities
Quickly filter entity types.
Categories
Entities are grouped logically, for example:
-
Generic
-
Aviation
-
Infrastructure
-
Credentials
-
Financial
-
OSINT
-
Custom entity groups
Entities
Each entity represents a structured data object.
Examples:
-
Text
-
Domain
-
Email
-
IP Address
-
Flight Number
-
Airline
-
Aircraft Model
-
Custom intelligence entities
To add an entity:
-
Drag it into the graph area
-
Or use Quick Run
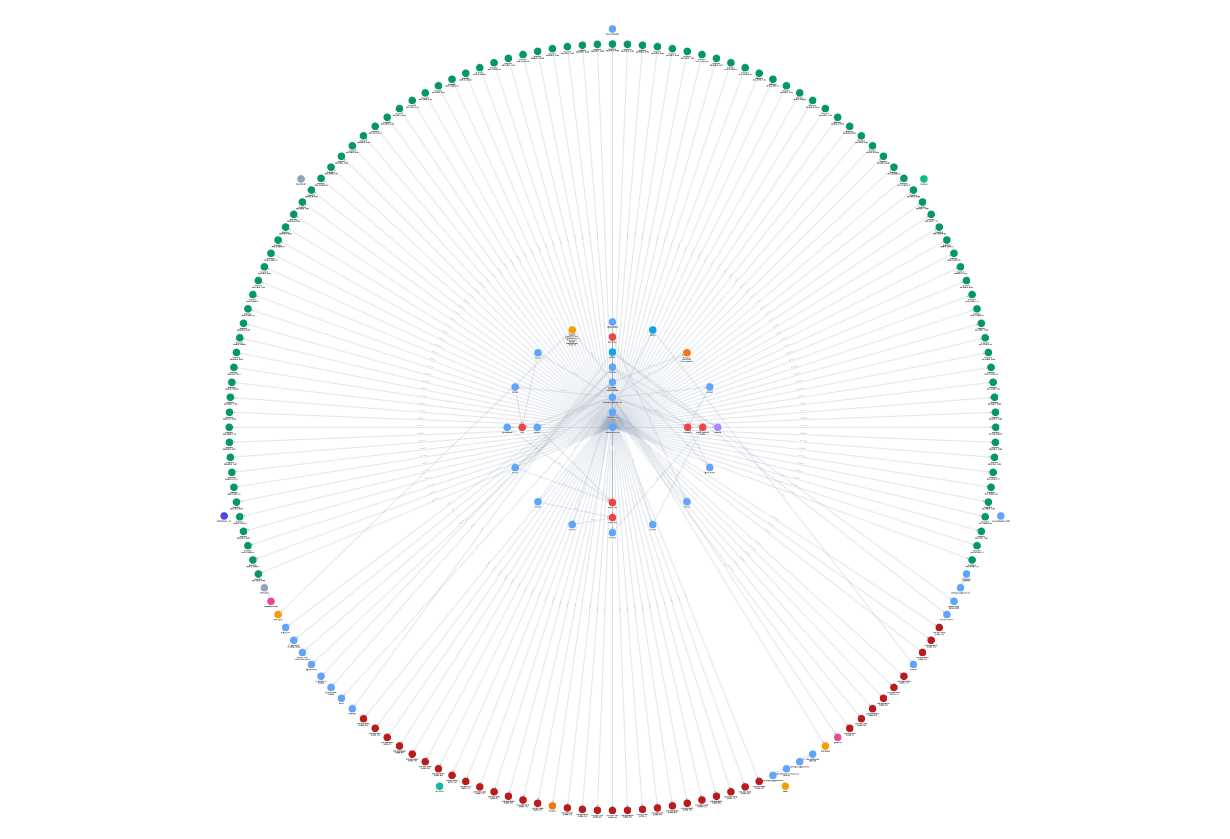
3. Graph View (Center Workspace)
The central workspace is where investigation takes place.
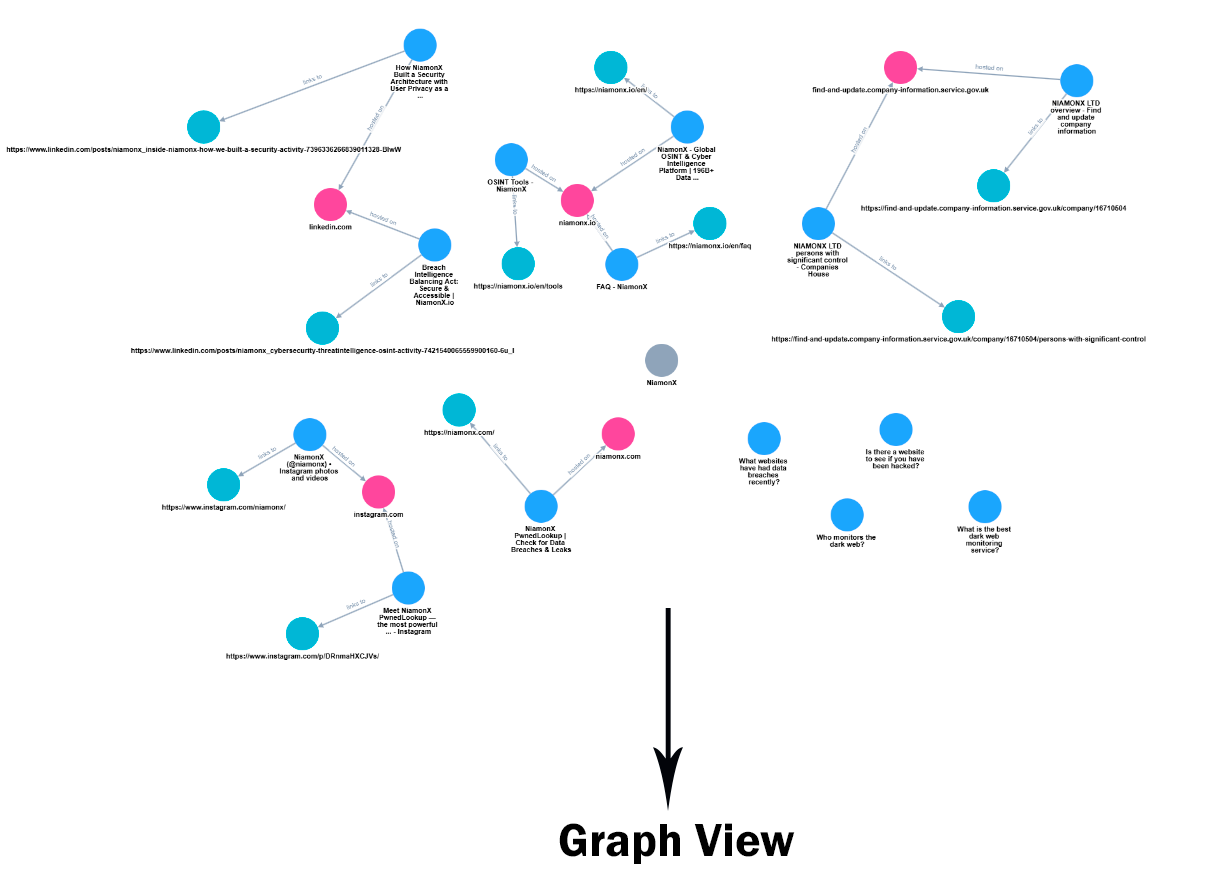
Nodes
Each node represents an entity:
-
Colored by type
-
Clickable
-
Expandable via transformers
-
Editable
Connections (Edges)
Edges represent relationships between entities:
-
Derived from enrichment transformers
-
Based on internal correlation logic
-
Smart relationship engine connects large datasets automatically
Smart Relationship Engine
NiamonX Graph intelligently links entities across datasets using:
-
Internal NiamonX intelligence sources
-
Cross-record correlations
-
Infrastructure relationships
-
Credential overlaps
-
DNS linkages
-
Blockchain references
Large datasets are automatically structured to avoid clutter and maximize analytical clarity.
4. Intelligence & Node Panel (Right Sidebar)
When a node is selected, the right panel displays detailed intelligence.
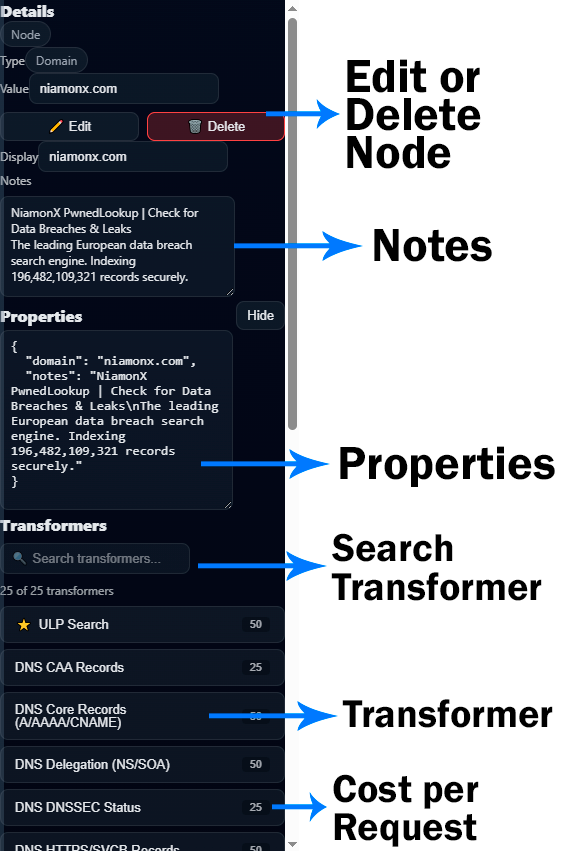
Node Details
Displays:
-
Node Type
-
Value
-
Display Name
Edit / Delete Node
Modify or remove nodes from the graph.
Notes
Add investigation notes to a node:
-
Observations
-
Hypotheses
-
Case references
-
Internal comments
Useful for collaborative investigations.
Properties
Displays structured JSON-like metadata for the node, including:
-
Domain data
-
Correlated breach references
-
Infrastructure attributes
-
Enrichment results
Search Transformer
Search among 50+ available enrichment transformers.
Transformers
Transformers expand nodes with additional intelligence.
Examples:
-
ULP Search
-
DNS Core Records (A/AAAA/CNAME)
-
DNS CAA Records
-
DNS Delegation (NS/SOA)
-
DNSSEC Status
-
PTR Reverse Lookup
-
Infrastructure resolution
-
Breach expansion
-
Email intelligence
Cost per Request
Each transformer displays resource cost per execution, allowing users to manage API credits efficiently.
Complete Workflow Example
-
Create a new graph.
-
Add a Domain node using Quick Run.
-
Run DNS transformers.
-
Expand infrastructure nodes.
-
Run breach enrichment.
-
Analyze relationships.
-
Add notes.
-
Share the graph with stakeholders.
-
Export structured intelligence if needed.
Designed for Large-Scale Intelligence
The interface is optimized for:
-
High-volume datasets
-
Complex multi-hop investigations
-
Real-time enrichment
-
Collaborative workflows
-
Controlled intelligence sharing
NiamonX Graph ensures that even massive interconnected datasets remain structured, readable, and actionable.