IP Intelligence Search | Global IP Lookup
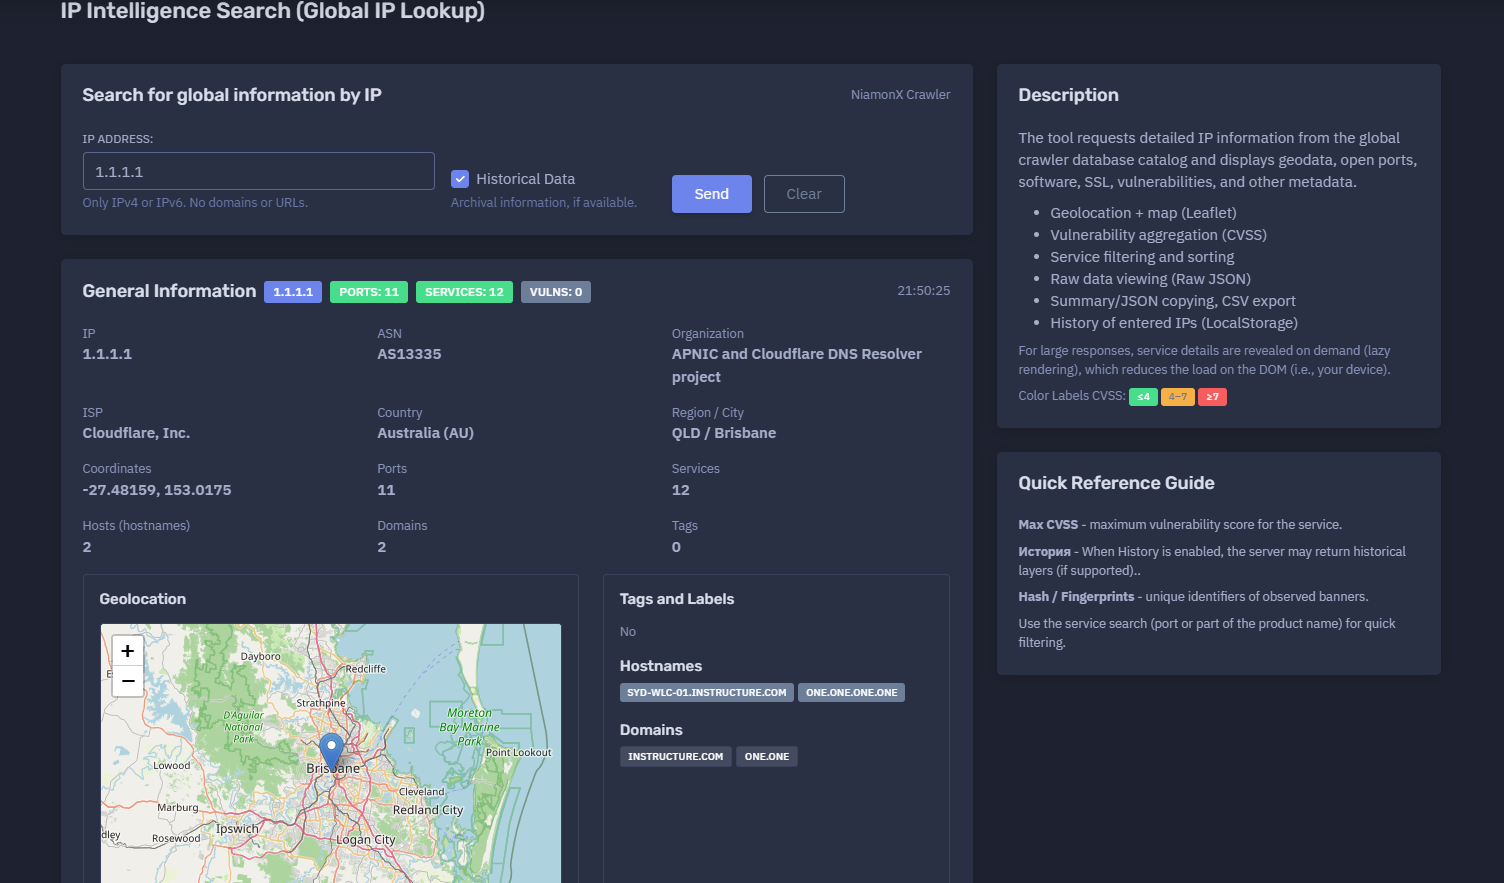
The platform available at https://dash.niamonx.io/global_iplookup — known as IP Intelligence Search (Global IP Lookup) — is a global IP intelligence and infrastructure analysis tool within the NiamonX platform. It allows users to search detailed information about IPv4 and IPv6 addresses using the NiamonX Crawler database catalog and receive structured data about geolocation, ASN, organization, ISP, open ports, services, hostnames, domains, vulnerabilities, fingerprints, and raw service metadata.
Overview of the Service
IP Intelligence Search (Global IP Lookup) is designed for analysts, SOC teams, cybersecurity researchers, incident responders, infrastructure owners, and OSINT specialists who need to understand what is publicly observable about a specific IP address.
The tool provides a consolidated view of an IP address from a global crawler database. It can show the IP’s network ownership, ASN, organization, ISP, country, region, city, coordinates, related hostnames, associated domains, exposed ports, detected products, service banners, HTTP metadata, SSL-related data when available, vulnerability aggregation, CVSS scoring, tags, labels, and raw JSON for deeper inspection.
The module accepts only IP addresses. Domains, URLs, paths, and search operators are not valid inputs.
🔍 How the Search Works
When a user enters an IPv4 or IPv6 address, the tool queries the global crawler database catalog and returns the available record for that IP.
The returned information may include:
-
General IP information
-
ASN and network ownership
-
ISP and organization
-
Country, region, city, and coordinates
-
Map location
-
Hostnames
-
Domains
-
Open ports
-
Protocols
-
Products and versions
-
Service details
-
HTTP metadata
-
SSL metadata, when available
-
Vulnerability data
-
CVE count
-
Maximum CVSS score
-
Scan dates
-
Raw service JSON
-
Historical layers, when available and enabled
The tool displays general information first, then provides a detailed services and ports table. Large service responses are rendered lazily, meaning details are shown only when the user expands a specific service row. This reduces browser and DOM load, especially for IPs with many open services.
🧩 What Can Be Searched
Global IP Lookup supports:
-
IPv4 addresses
-
IPv6 addresses
Valid examples:
1.1.1.1
8.8.8.8
2001:4860:4860::8888
Unsupported inputs:
example.com
https://example.com
example.com/login
1.1.1.1:443
The tool expects only a clean IPv4 or IPv6 value.
⚙️ Search Interface
The interface contains the main input and optional historical data setting.
IP Address
The main field where the user enters an IPv4 or IPv6 address.
Example:
1.1.1.1
The interface clearly states:
Only IPv4 or IPv6. No domains or URLs.
Historical Data
The Historical Data option allows the server to return archival information when supported.
Historical layers may include older observations, previous ports, older banners, previous technologies, or past service states.
Important: historical data is returned only when available and supported by the backend.
📊 General Information
After a successful lookup, the tool displays a general information panel for the IP address.
Possible fields include:
| Field | Description |
|---|---|
| IP | Queried IPv4 or IPv6 address |
| ASN | Autonomous System Number |
| Organization | Network owner or responsible organization |
| ISP | Internet Service Provider |
| Country | Country and country code |
| Region / City | Geographic region and city |
| Coordinates | Latitude and longitude |
| Ports | Number of observed ports |
| Services | Number of service records |
| Hosts | Number of hostnames |
| Domains | Number of related domains |
| Tags | Number of tags or labels |
Example structure:
IP: 1.1.1.1
ASN: AS13335
Organization: Example Network Project
ISP: Example ISP
Country: Australia (AU)
Region / City: QLD / Brisbane
Coordinates: -27.48159, 153.0175
Ports: 11
Services: 12
Vulns: 0
This section gives users a quick operational overview of the IP address before reviewing individual services.
🗺️ Geolocation and Map
The tool includes a geolocation map powered by Leaflet and OpenStreetMap.
The map displays the approximate location of the IP address based on geolocation data returned by the crawler database.
Possible location fields:
-
Country
-
Country code
-
Region
-
Region code
-
City
-
Latitude
-
Longitude
Important interpretation notes:
-
IP geolocation is approximate.
-
The city may represent network registration, routing, infrastructure, or geolocation provider estimation.
-
Coordinates may not represent the physical location of a device.
-
Cloud, CDN, VPN, proxy, and resolver IPs may show provider locations rather than end-user locations.
Geolocation should be used as context, not as precise physical attribution.
🏷️ Tags and Labels
The tool can display tags and labels returned by the crawler database.
Examples of possible tags:
-
CDN
-
Cloud
-
VPN
-
Proxy
-
Resolver
-
Hosting
-
Mail
-
Web
-
Database
-
Industrial
-
IoT
-
Remote access
No
🌐 Hostnames and Domains
The tool displays hostnames and domains associated with the IP address when available.
Hostnames
Hostnames may include DNS names, reverse DNS names, or observed service names.
Example:
one.one.one.one
Domains
Domains may include root domains or associated domains found in the crawler data.
Example:
one.one
Important notes:
-
Hostnames and domains may be historical.
-
Shared infrastructure may host many unrelated domains.
-
CDN and cloud IPs can be associated with multiple customers.
-
A hostname association does not always mean exclusive ownership of the IP.
🔌 Services and Ports
The Services / Ports section displays observed open ports and detected services.
The table may include:
| Column | Description |
|---|---|
| Port | Port number |
| Protocol | TCP or UDP |
| Product / Version | Detected product and version |
| CVEs | Number of linked CVEs |
| Max CVSS | Maximum vulnerability severity score |
| Scan | Scan date |
Example service rows:
53    TCP    —           0    —    2026-06-17
443   TCP    CloudFlare  0    —    2026-06-17
8880  TCP    CloudFlare  0    —    2026-06-17
The table can be filtered by port or product name, allowing analysts to quickly find relevant services.
🔎 Service Filtering and Sorting
The services table supports quick filtering.
Users can search by:
-
Port number
-
Product name
-
Version
-
Protocol
-
Service text
Example:
Filter: 443
Filter: CloudFlare
Sorting by columns helps analysts prioritize:
-
Exposed services
-
Highest CVSS score
-
Most recent scan date
-
Specific ports
-
Specific protocols
-
Products with known vulnerabilities
🧾 Service Details
Clicking the disclosure button on a service row opens detailed service information.
The details view may include:
Main
-
Product
-
Version
-
Operating system
-
Scan date
HTTP
-
HTTP status
-
Server header
-
Page title
-
Redirect location
-
WAF or CDN indicator
-
Headers hash
-
HTML hash
-
DOM hash
-
Robots data
-
Sitemap data
-
Security.txt data
-
Components
Location
-
City
-
Country
-
Coordinates
Vulnerabilities
-
CVE list
-
CVSS scores
-
Vulnerability metadata, when available
Raw JSON
-
Full normalized service record returned by the backend
This drill-down structure allows the interface to remain fast while still providing deep technical visibility when needed.
🌐 HTTP Metadata
For HTTP or HTTPS services, the tool may show HTTP-level metadata.
Possible fields include:
| Field | Description |
|---|---|
| Status | HTTP status code |
| Server | Server response header |
| Title | HTML page title |
| Location | Redirect target |
| WAF | Web application firewall or CDN indicator |
| Components | Detected technologies |
| HTML hash | Hash of returned HTML |
| Headers hash | Hash of headers |
| DOM hash | DOM fingerprint |
| Security.txt | Security policy file data, if found |
| Robots.txt | Robots file data, if found |
| Sitemap | Sitemap data, if found |
Example:
Status: 301
Server: cloudflare
Title: 301 Moved Permanently
Location: /
HTTP metadata is useful for web service fingerprinting, CDN detection, redirect analysis, and change tracking.
🧬 Hashes and Fingerprints
The tool may display multiple hashes and fingerprints.
Examples:
-
HTML hash
-
Headers hash
-
DOM hash
-
Server hash
-
Title hash
-
Banner hash
-
Service hash
These hashes are useful for:
-
Detecting repeated infrastructure
-
Finding similar services
-
Tracking changes over time
-
Fingerprinting web applications
-
Comparing banners
-
Identifying reused templates
-
Monitoring service drift
A hash does not identify a service by itself. It is a technical fingerprint that should be interpreted with context.
🛡️ Vulnerability Aggregation
The tool aggregates vulnerability data for services when CVEs are available.
The service table may show:
-
Number of CVEs
-
Maximum CVSS score
-
Vulnerability details
-
A severity color label
CVSS Color Labels
The interface may use color labels based on CVSS score.
General interpretation:
| CVSS Range | Severity |
|---|---|
| ≤ 4 | Low |
| 4–7 | Medium |
| ≥ 7 | High |
The Max CVSS field shows the maximum vulnerability score associated with the service.
Important: a CVE association does not always prove exploitability. Product detection, version accuracy, configuration, and exposure context must be validated manually.
📦 Raw JSON Viewer
Each service can include a raw JSON view.
Raw JSON may contain:
-
Product detection
-
HTTP metadata
-
Scan timestamp
-
Organization
-
ISP
-
ASN
-
Port
-
Protocol
-
Hostnames
-
Domains
-
Location
-
CPE / CPE 2.3 identifiers
-
Hashes
-
Banner data
-
Scanner metadata
-
Transport information
-
Vulnerability data
Raw JSON is useful for:
-
Technical diagnostics
-
API workflows
-
Evidence preservation
-
Security reporting
-
Advanced analysis
-
Integration with SIEM or case systems
-
Comparing normalized and raw fields
Raw data should be handled carefully because it may include detailed infrastructure fingerprints.
🕓 Historical Data
When the Historical Data option is enabled, the backend may return archival information if supported.
Historical data can help analysts understand:
-
Previously open ports
-
Past service banners
-
Old product versions
-
Previous hostnames
-
Infrastructure changes
-
Exposure timeline
-
Service drift
-
Reappearance of risky services
Important interpretation:
When History is enabled, the server may return historical layers if supported.
Historical data may not be available for every IP address and should be clearly separated from current observations.
📤 Export and Copy Options
The tool supports analyst-friendly export and copy workflows.
Possible output options include:
-
Summary copying
-
JSON copying
-
CSV export
-
Raw service JSON viewing
-
Filtered service review
CSV export is useful for:
-
Port inventory
-
Exposure reports
-
Vulnerability review
-
Asset documentation
-
SOC workflows
-
Compliance evidence
-
Incident response records
Exports should be stored securely, especially when they include infrastructure fingerprints or vulnerability data.
🕘 Request History
The tool may store entered IPs in local browser history through LocalStorage.
History can help users quickly repeat previous lookups.
Local history may include:
-
IP address
-
Query timestamp
-
Search mode
-
History option state
-
Basic result metadata
Because this history is browser-local, it may be cleared when users delete browser data or switch devices.
🧠 Key Features
Global IP Lookup
Search detailed information about IPv4 and IPv6 addresses.
NiamonX Crawler Database
Results come from the global crawler database catalog.
General IP Intelligence
Shows ASN, organization, ISP, country, region, city, coordinates, ports, services, hostnames, domains, and tags.
Geolocation Map
Displays approximate location on a Leaflet / OpenStreetMap map.
Service and Port Inventory
Lists observed open ports, protocols, products, versions, scan dates, CVE counts, and Max CVSS.
Vulnerability Aggregation
Aggregates CVE and CVSS data per service when available.
Raw JSON
Allows detailed inspection of service-level raw records.
Lazy Rendering
Large service details are rendered only when opened, reducing browser load.
Historical Data
Can request archival information when supported.
Filtering and Sorting
Users can search services by port or product name and sort columns.
Export
Supports summary / JSON copy and CSV export.
Local History
Stores previously entered IPs locally in the browser.
✅ Recommended Analyst Workflow
A practical IP investigation workflow should follow these steps.
1. Enter a Clean IP Address
Use only IPv4 or IPv6. Do not include domains, URLs, ports, or paths.
2. Review General Information
Check ASN, organization, ISP, country, region, city, coordinates, ports, services, hostnames, and domains.
3. Check Geolocation
Use the map for approximate context, but do not treat it as exact physical attribution.
4. Review Open Ports
Sort and filter services by port, product, scan date, or CVSS score.
5. Expand Important Services
Open details for exposed web services, remote access services, databases, or unusual ports.
6. Review Vulnerability Data
Check CVE count and Max CVSS, but validate product and version accuracy before making conclusions.
7. Inspect Raw JSON When Needed
Use raw data for deeper technical analysis or integration workflows.
8. Compare Current and Historical Data
Enable historical data when investigating exposure changes over time.
9. Export Evidence
Use CSV or JSON export for internal reporting.
10. Validate Before Action
Confirm important findings with additional tools, asset owners, or direct authorized scans.
🛡️ Security, Privacy & Responsible Use
IP Intelligence Search is intended for lawful cybersecurity, OSINT, asset analysis, incident response, and exposure management.
Acceptable use cases include:
-
Checking your own infrastructure
-
Investigating suspicious IPs
-
Reviewing exposed services
-
SOC triage
-
Threat intelligence enrichment
-
Vulnerability exposure review
-
Asset inventory validation
-
Incident response
-
Historical infrastructure analysis
-
Compliance reporting
Users must follow responsible use rules:
-
Do not use the tool to attack systems.
-
Do not use exposed services for unauthorized access.
-
Do not exploit vulnerabilities discovered through the tool.
-
Do not harass, disrupt, or target third-party infrastructure.
-
Validate vulnerability findings before escalation.
-
Respect applicable laws and authorization boundaries.
-
Treat exported infrastructure data as sensitive.
-
Use results for defensive and analytical purposes only.
⚙️ Technical Highlights
-
Global IP intelligence search
-
Available at
dash.niamonx.io/global_iplookup -
Powered by NiamonX Crawler database catalog
-
Supports IPv4 and IPv6
-
Rejects domains and URLs
-
Optional historical data
-
General IP profile
-
ASN, organization, ISP, country, city, and coordinates
-
Leaflet geolocation map
-
Hostnames and domains
-
Tags and labels
-
Services and ports table
-
TCP and UDP support
-
Product and version detection
-
HTTP metadata
-
SSL metadata when available
-
CPE and CPE 2.3 identifiers
-
Vulnerability aggregation
-
CVE counts
-
Max CVSS field
-
CVSS color labels
-
Port and product filtering
-
Column sorting
-
Service detail disclosure
-
Lazy rendering for large responses
-
Raw JSON viewer
-
Summary / JSON copy
-
CSV export
-
LocalStorage history of entered IPs
-
Suitable for SOC, OSINT, vulnerability review, asset monitoring, and incident response workflows
📌 Usage Hints
-
Enter only an IPv4 or IPv6 address.
-
Do not enter domains, URLs, paths, or IP:port values.
-
Use the service search field to filter by port or product name.
-
Check Max CVSS for quick vulnerability triage.
-
Expand service details for HTTP headers, banners, fingerprints, and raw JSON.
-
Use historical data when investigating changes over time.
-
Treat geolocation as approximate.
-
Treat CVE matches as leads until validated.
-
Use CSV export for service inventory.
-
Use JSON copy for technical workflows.
-
Clear local history on shared devices.
-
Use findings only for lawful defensive analysis.
📬 Contact Information
For technical, legal, abuse, privacy, or support-related inquiries, users can contact the NiamonX team directly:
support@niamonx.io — Technical Support
other@niamonx.io — General Inquiries
takedown@niamonx.io — Privacy or Data Removal Requests
legal@niamonx.io — Legal and Compliance Matters
Alternative contact channel:
🔗 Helpdesk: https://support.niamonx.io/
Summary
NiamonX IP Intelligence Search (Global IP Lookup) is a global IP intelligence tool for analyzing IPv4 and IPv6 addresses through the NiamonX Crawler database catalog.
It provides ASN, organization, ISP, geolocation, hostnames, domains, open ports, services, products, HTTP metadata, fingerprints, CVEs, CVSS scores, historical layers, raw JSON, filtering, sorting, CSV export, and local lookup history.
The tool is designed for lawful OSINT, SOC triage, threat intelligence, vulnerability review, asset monitoring, compliance, and incident response. Results should be treated as intelligence signals and validated before operational or security decisions.