Host Diagnostics | Multi-Protocol Network Diagnostic Tool
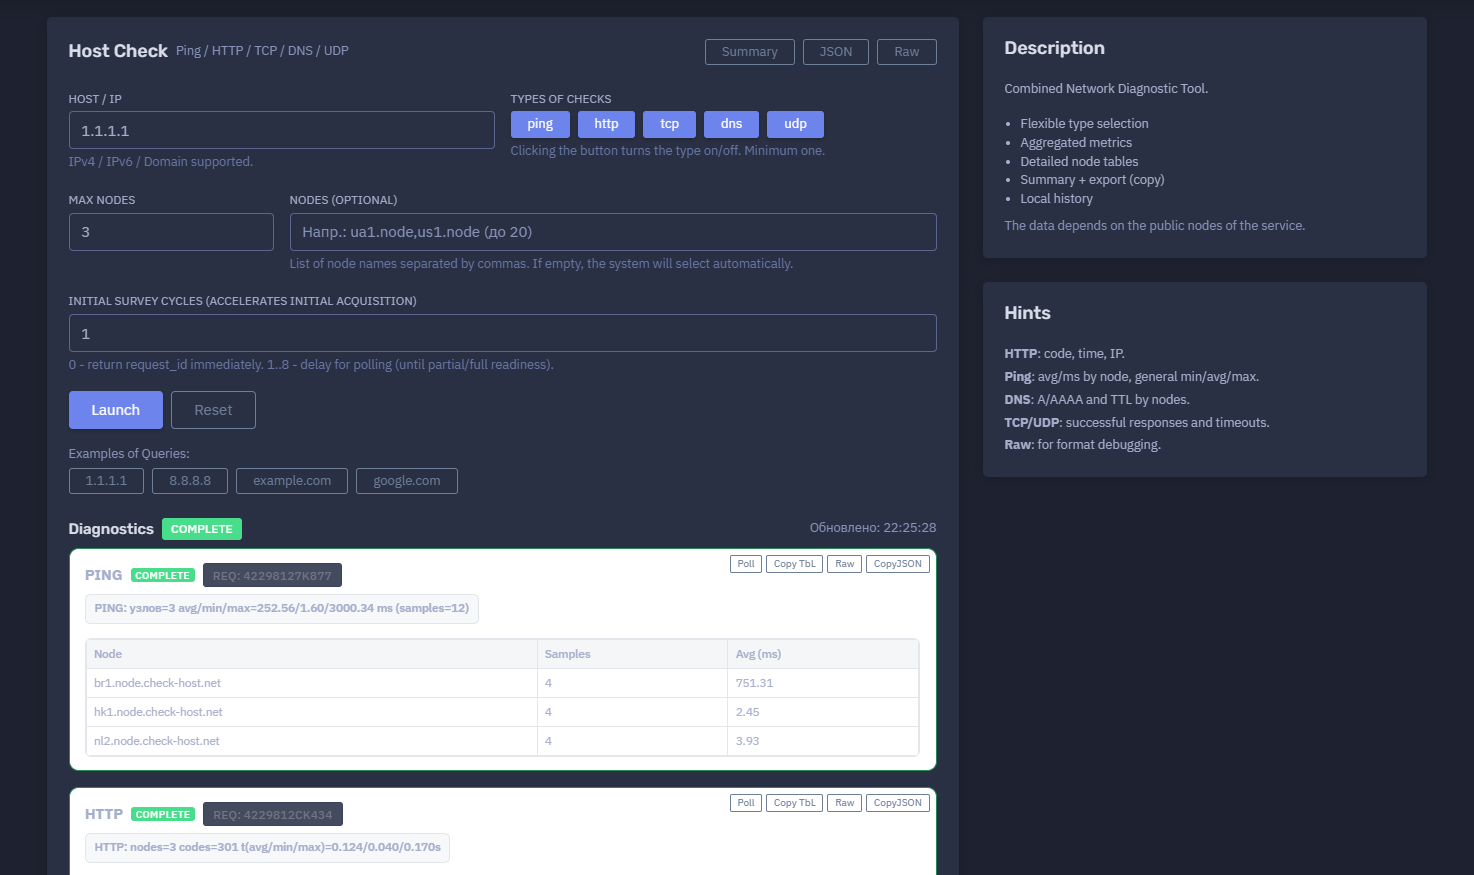
The platform available at https://dash.niamonx.io/host_diagnostics — known as Host Diagnostics — is a combined network diagnostic tool within the NiamonX platform. It allows users to check a host, IP address, or domain across multiple network layers using Ping, HTTP, TCP, DNS, and UDP diagnostics from distributed public nodes.
Overview of the Service
Host Diagnostics is designed to provide a structured, multi-protocol view of host availability and network behavior.
Unlike a single ping or DNS lookup, this tool performs several types of checks in one workflow. It can verify whether a target responds to ICMP-style ping checks, whether HTTP is reachable, whether TCP connectivity works, whether DNS resolution is available, and whether UDP responses are received from selected diagnostic nodes.
The tool is useful for:
-
Network troubleshooting
-
Website availability checks
-
Infrastructure diagnostics
-
SOC and incident response workflows
-
DevOps and uptime analysis
-
DNS and routing validation
-
Regional connectivity review
-
Firewall and filtering checks
-
Basic service reachability testing
-
External monitoring from multiple nodes
The data depends on public diagnostic nodes used by the service. Results should be treated as network diagnostics and validated with additional tools for critical infrastructure decisions.
🔍 How the Tool Works
The user enters a target host, IP address, or domain and selects one or more diagnostic check types.
Supported target types:
-
IPv4 address
-
IPv6 address
-
Domain name
-
Hostname
Supported check types:
-
Ping
-
HTTP
-
TCP
-
DNS
-
UDP
At least one check type must be enabled. The user can also define how many diagnostic nodes should be used and optionally specify node names manually.
After the request is submitted, the backend starts one or more diagnostic jobs. Each selected check type receives its own request ID and progresses independently until it reaches a final state such as complete, partial, failed, or timeout.
The final result is displayed as a combined diagnostic report with aggregated metrics and detailed node tables.
🧩 What Can Be Checked
Host Diagnostics supports three main categories of targets.
IPv4 Address
Example:
1.1.1.1
IPv6 Address
Example:
2606:4700:4700::1111
Domain or Hostname
Example:
niamonx.io
api.example.com
The tool should not be used with full URLs, paths, or query strings unless a specific check type supports that behavior. For best results, users should enter only the clean host, IP, or domain.
⚙️ Diagnostic Interface
The interface includes several key controls.
Host / IP
The main input field where the user enters the target.
Example:
1.1.1.1
Supported formats:
-
IPv4
-
IPv6
-
Domain
-
Hostname
Types of Checks
Users can enable or disable diagnostic types by clicking the corresponding buttons.
Available checks:
-
Ping
-
HTTP
-
TCP
-
DNS
-
UDP
At least one type must remain selected.
Max Nodes
Controls how many nodes should be used for each check.
Example:
Max nodes: 3
Using more nodes provides broader geographic visibility but may increase processing time.
Nodes Optional
Users can optionally specify node names manually.
Example format:
ua1.node,us1.node
Up to 20 node names may be entered as a comma-separated list, depending on backend limits.
If the field is empty, the system selects nodes automatically.
Initial Survey Cycles
Controls whether the request should return immediately with a request ID or wait briefly for partial or full readiness.
Example:
Initial survey cycles: 1
Interpretation:
| Value | Meaning |
|---|---|
| 0 | Return request ID immediately |
| 1–8 | Wait for polling until partial or full readiness |
This option can make the first response more useful by allowing the backend to collect initial data before returning results.
📊 Combined Diagnostics Status
The main diagnostics panel displays the global status of the selected checks.
Example:
Diagnostics
COMPLETE
Updated: 22:25:28
Possible status values may include:
| Status | Meaning |
|---|---|
| COMPLETE | All selected checks reached a final completed state |
| PARTIAL | Some checks or nodes returned results, while others did not |
| RUNNING | Checks are still in progress |
| FAILED | The diagnostic job failed |
| TIMEOUT | The check did not complete within the expected time |
| ERROR | Backend or parsing error occurred |
A complete status means the requested checks finished, not necessarily that every service responded successfully.
🛰️ Node-Based Diagnostics
Host Diagnostics uses external nodes to test the target from different network locations.
Each node may return different results because of:
-
Geographic routing
-
Firewall rules
-
DNS differences
-
CDN behavior
-
Anycast behavior
-
Regional filtering
-
Network congestion
-
Provider outages
-
IPv4 / IPv6 availability
-
Target-side rate limiting
Node-based diagnostics are especially useful when a host works from one region but fails from another.
📡 Ping Check
The Ping check measures basic network reachability and latency.
Example summary:
PING: nodes=3 avg/min/max=252.56/1.60/3000.34 ms samples=12
The Ping section may include:
-
Request ID
-
Number of nodes
-
Average RTT
-
Minimum RTT
-
Maximum RTT
-
Number of samples
-
Per-node average latency
Example table:
| Node | Samples | Avg ms |
|---|---|---|
| br1.node.check-host.net | 4 | 751.31 |
| hk1.node.check-host.net | 4 | 2.45 |
| nl2.node.check-host.net | 4 | 3.93 |
Ping Interpretation
Ping is useful for checking:
-
Basic availability
-
Network latency
-
Packet-level reachability
-
Regional routing differences
-
Possible filtering or packet loss
High ping values may indicate long-distance routing, congestion, packet loss, or regional network problems.
A failed ping does not always mean the host is down. Some hosts block ICMP-style traffic while still serving HTTP, TCP, or DNS normally.
🌐 HTTP Check
The HTTP check verifies whether the target responds over HTTP or HTTPS-style web checks, depending on backend behavior.
Example summary:
HTTP: nodes=3 codes=301 t(avg/min/max)=0.124/0.040/0.170s
The HTTP section may include:
-
Request ID
-
HTTP status codes
-
Average response time
-
Minimum response time
-
Maximum response time
-
Node-level status
-
Resolved IP used by the node
Example table:
| Node | Code | Status | Time s | IP |
|---|---|---|---|---|
| ir5.node.check-host.net | 301 | Moved Permanently | 0.164 | 1.1.1.1 |
| ir7.node.check-host.net | 301 | Moved Permanently | 0.170 | 1.1.1.1 |
| si1.node.check-host.net | 301 | Moved Permanently | 0.040 | 1.1.1.1 |
HTTP Interpretation
HTTP diagnostics are useful for checking:
-
Web availability
-
HTTP status codes
-
Redirect behavior
-
Response time
-
Regional web reachability
-
Basic CDN or proxy behavior
Common HTTP codes:
| Code | Meaning |
|---|---|
| 200 | OK |
| 301 | Moved Permanently |
| 302 | Found / temporary redirect |
| 403 | Forbidden |
| 404 | Not Found |
| 500 | Server error |
| 502 / 503 / 504 | Gateway or service availability problem |
A successful HTTP response does not always mean the application is healthy. It only confirms that an HTTP-level response was returned.
🔌 TCP Check
The TCP check tests whether a TCP connection can be established.
Example summary:
TCP: success=3/3 t=0.004/0.001/0.010s
The TCP section may include:
-
Request ID
-
Number of successful nodes
-
Total nodes
-
Average / minimum / maximum connection time
-
Per-node result
-
Per-node response time
Example table:
| Node | Status | Time s |
|---|---|---|
| ae1.node.check-host.net | OK | 0.010 |
| es1.node.check-host.net | OK | 0.002 |
| in3.node.check-host.net | OK | 0.001 |
TCP Interpretation
TCP checks are useful for verifying:
-
Port-level reachability
-
Firewall behavior
-
Regional blocking
-
Service availability
-
Connection establishment time
-
Basic network path health
A successful TCP check means the node could establish a connection. It does not necessarily validate the full application protocol.
🧭 DNS Check
The DNS check verifies DNS resolution from selected diagnostic nodes.
Example summary:
DNS: nodes=3 A=0 AAAA=0 TTL(min/max)=1001/1523
The DNS section may include:
-
Request ID
-
Number of nodes
-
A records
-
AAAA records
-
TTL values
-
Per-node DNS results
Example table:
| Node | A | AAAA | TTL |
|---|---|---|---|
| nl1.node.check-host.net | - | - | 1523 |
| nl2.node.check-host.net | - | - | 1509 |
| rs1.node.check-host.net | - | - | 1001 |
DNS Interpretation
DNS diagnostics are useful for:
-
Checking whether a domain resolves globally
-
Comparing A / AAAA responses by node
-
Identifying TTL differences
-
Diagnosing DNS propagation
-
Detecting resolver-specific failures
-
Validating CDN or GeoDNS behavior
If the target is an IP address rather than a domain, DNS results may be limited or empty depending on backend behavior.
📦 UDP Check
The UDP check attempts UDP-level diagnostics from selected nodes.
Example summary:
UDP: answers=0/3 0.0% timeouts=3
The UDP section may include:
-
Request ID
-
Number of answers
-
Total nodes
-
Answer percentage
-
Timeout count
-
Per-node result
Example table:
| Node | Result |
|---|---|
| bg1.node.check-host.net | Timeout |
| pt1.node.check-host.net | Timeout |
| rs1.node.check-host.net | Timeout |
UDP Interpretation
UDP diagnostics are useful for checking:
-
UDP responsiveness
-
Firewall behavior
-
Timeout patterns
-
Regional UDP filtering
-
Service exposure
-
DNS, VPN, VoIP, gaming, or other UDP-based behavior
UDP is connectionless, so timeouts are common and may not always indicate failure. Many services do not respond to generic UDP probes.
📋 Aggregated Metrics
Host Diagnostics provides summaries for each check type.
Examples:
PING: avg/min/max
HTTP: status codes and response time
TCP: success rate and connection time
DNS: A/AAAA and TTL
UDP: answers and timeouts
Aggregated metrics help analysts quickly identify which layer is failing.
For example:
-
Ping fails but HTTP works: ICMP may be blocked.
-
DNS fails but TCP works by IP: DNS problem likely.
-
HTTP fails but TCP works: application or web-layer issue.
-
TCP fails from some nodes only: regional filtering or routing issue.
-
UDP times out everywhere: UDP service may be closed, filtered, or non-responsive.
🧾 Request IDs
Each check type may receive its own request ID.
Example:
Req: 42298127k877
Request IDs help track individual diagnostic jobs and are useful when polling, debugging, or comparing results.
🧪 Initial Survey Cycles
The Initial survey cycles setting controls how quickly the initial response is returned.
0 Cycles
The tool returns the request ID immediately.
This is useful for asynchronous workflows where the user or interface will poll later.
1–8 Cycles
The tool waits briefly for partial or complete readiness before returning the result.
This can speed up the user experience because initial data may already be available when the result appears.
🧠 Key Features
Combined Network Diagnostics
Runs Ping, HTTP, TCP, DNS, and UDP checks from one interface.
Flexible Type Selection
Users can enable or disable check types as needed.
Multi-Node Testing
Checks can run from several public diagnostic nodes.
Automatic Node Selection
If no nodes are specified, the system selects nodes automatically.
Manual Node Selection
Advanced users can specify node names manually.
Aggregated Metrics
Each check type includes summarized performance and availability data.
Detailed Node Tables
Per-node results show regional differences and diagnostic details.
Summary Copy
The tool can provide a copyable summary for reports or tickets.
Export Support
Diagnostic results can be copied or exported for documentation.
Local History
Previous checks are stored locally in the browser.
Raw Output
Raw data can be used for format debugging and deeper troubleshooting.
🕓 Request History
The Request History section stores previous diagnostic checks locally in the browser.
History entries may include:
-
Target host or IP
-
Selected check types
-
Result status
-
Timestamp
Example history item:
1.1.1.1
dns,http,ping,tcp,udp
OK
17.06.2026, 22:25:28
Possible history statuses:
| Status | Meaning |
|---|---|
| OK | Diagnostic completed successfully |
| PART | Partial result |
| FAIL | Failed result |
| ERROR | Error occurred |
Local history helps repeat previous diagnostics and compare results over time.
Because it is stored in the browser, it may be cleared when users delete browser data or switch devices.
🔧 Raw Output
The tool may provide raw output for format debugging.
Raw data can help developers and analysts understand:
-
Backend response structure
-
Node-level payloads
-
Timing fields
-
Status fields
-
Partial responses
-
Formatting issues
-
Parsing behavior
Raw output is useful for technical troubleshooting but should not be necessary for normal users.
✅ Recommended Diagnostic Workflow
A practical host diagnostic workflow should follow these steps.
1. Enter the Target
Use an IPv4 address, IPv6 address, domain, or hostname.
2. Select Check Types
Enable Ping, HTTP, TCP, DNS, UDP, or only the checks relevant to the issue.
3. Set Max Nodes
Use 3 nodes for quick checks or more nodes for broader regional diagnostics.
4. Specify Nodes If Needed
Enter node names manually when testing from specific regions.
5. Choose Initial Survey Cycles
Use 1 for a balanced interactive result or 0 for immediate request ID return.
6. Review Global Status
Check whether the overall result is complete, partial, failed, or still running.
7. Analyze Each Layer
Review Ping, HTTP, TCP, DNS, and UDP independently.
8. Compare Nodes
Look for regions where one node fails while others succeed.
9. Identify the Failing Layer
Use differences between protocols to isolate DNS, web, TCP, UDP, or routing problems.
10. Copy or Export Results
Use summaries for incident tickets, reports, or support communication.
🔎 Common Use Cases
Host Diagnostics can support many technical workflows.
Website Availability Check
Use HTTP and DNS checks to confirm whether a website is reachable.
Network Reachability Check
Use Ping and TCP checks to verify basic connectivity.
DNS Propagation Review
Use DNS checks across nodes to compare A, AAAA, and TTL values.
Firewall Troubleshooting
Compare TCP / UDP / Ping behavior to identify filtering.
Incident Response
Quickly determine whether a target is globally down or regionally affected.
DevOps Monitoring
Use repeated diagnostics to investigate deployment, DNS, or routing issues.
SOC Triage
Check suspicious hosts or infrastructure indicators from multiple layers.
Regional Connectivity Analysis
Use node-level results to identify geographic network problems.
⚠️ Result Interpretation Notes
Host Diagnostics results should be interpreted carefully.
Important limitations:
-
Public nodes may have their own outages or restrictions.
-
A failed ping does not always mean the service is down.
-
HTTP checks may follow redirects or return expected non-200 statuses.
-
TCP success does not prove application health.
-
DNS results may vary by resolver, cache, or geography.
-
UDP timeouts are common and not always a failure.
-
Some targets block diagnostic nodes.
-
Results can be partial while some checks are still updating.
-
Different nodes may see different network paths.
-
Data depends on public nodes of the service.
For production incidents, combine Host Diagnostics with server logs, application monitoring, traceroute, firewall logs, DNS provider dashboards, and cloud provider status pages.
🛡️ Security, Privacy & Responsible Use
Host Diagnostics is intended for lawful network diagnostics, troubleshooting, uptime checks, incident response, and infrastructure analysis.
Acceptable use cases include:
-
Checking your own infrastructure
-
Troubleshooting website downtime
-
Validating DNS resolution
-
Testing TCP connectivity
-
Reviewing UDP reachability
-
Supporting incident response
-
Comparing regional network behavior
-
Preparing support tickets
-
SOC enrichment of network indicators
-
DevOps and monitoring workflows
Users should follow responsible use principles:
-
Do not use the tool to harass or overload third-party infrastructure.
-
Do not repeatedly test systems without a legitimate reason.
-
Do not interpret diagnostic failures as proof of malicious activity.
-
Do not rely on one check type for critical conclusions.
-
Validate important findings with additional sources.
-
Treat local history as potentially sensitive on shared devices.
-
Use the tool only for lawful and ethical diagnostics.
⚙️ Technical Highlights
-
Combined network diagnostic tool
-
Available at
dash.niamonx.io/host_diagnostics -
Supports IPv4
-
Supports IPv6
-
Supports domains and hostnames
-
Check types: Ping, HTTP, TCP, DNS, UDP
-
Minimum one check type required
-
Flexible check type selection
-
Max nodes control
-
Optional manual node list
-
Automatic node selection
-
Initial survey cycles for faster initial acquisition
-
Per-check request IDs
-
Aggregated metrics
-
Detailed node tables
-
Ping avg / min / max and samples
-
HTTP status code, status text, time, and IP
-
TCP success rate and connection time
-
DNS A / AAAA and TTL by node
-
UDP answer rate and timeouts
-
Combined diagnostics status
-
Summary copy
-
Export support
-
Local browser request history
-
Raw output for debugging
-
Suitable for network diagnostics, SOC, DevOps, incident response, and infrastructure monitoring
📌 Usage Hints
-
Enter an IPv4 address, IPv6 address, domain, or hostname.
-
Select at least one check type.
-
Use Ping for latency and basic reachability.
-
Use HTTP for web status, response time, and resolved IP.
-
Use TCP for connection-level availability.
-
Use DNS for A / AAAA and TTL comparison.
-
Use UDP for UDP response and timeout checks.
-
Use more nodes for broader regional visibility.
-
Leave the node list empty for automatic selection.
-
Use manual nodes when testing from specific regions.
-
Set initial survey cycles to
0if you need the request ID immediately. -
Use Raw output for format debugging.
-
Remember that public node availability affects results.
-
Store copied diagnostics securely when used in incident reports.
📬 Contact Information
For technical, legal, abuse, privacy, or support-related inquiries, users can contact the NiamonX team directly:
support@niamonx.io — Technical Support
other@niamonx.io — General Inquiries
takedown@niamonx.io — Privacy or Data Removal Requests
legal@niamonx.io — Legal and Compliance Matters
Alternative contact channel:
🔗 Helpdesk: https://support.niamonx.io/
Summary
NiamonX Host Diagnostics is a combined multi-protocol network diagnostic tool for checking IPv4 addresses, IPv6 addresses, domains, and hostnames across Ping, HTTP, TCP, DNS, and UDP layers.
It supports flexible check selection, multi-node testing, automatic or manual node selection, initial survey cycles, per-check request IDs, aggregated metrics, node-level tables, summary copy, export support, local browser history, and raw output for debugging.
The tool is designed for network troubleshooting, DevOps workflows, SOC triage, incident response, website availability checks, DNS diagnostics, firewall validation, and regional connectivity analysis. Results should be interpreted as diagnostic signals and validated with additional monitoring sources for critical decisions.