Website and Host Analysis
Website and Host Analysis
- Phishing Check | URL Threat Inspection
- Host Diagnostics | Multi-Protocol Network Diagnostic Tool
- Domain WHOIS Checker | WHOIS / RDAP Domain Intelligence
- WebSite Screenshot | Web Capture & Device Emulation Tool
- Website to PDF | Webpage PDF Conversion Tool
- IP WHOIS | RDAP / WHOIS IP Intelligence Tool
- Subdomains Extended | Subdomain Discovery & DNS Inventory Tool
- Subdomains Check | Subdomain Enumeration Tool
- Subdomains Check V2 | Experimental Subdomain & DNS Records Discovery Tool
- URL Shortener | Custom Short Link Creation Tool
- DNSSEC Configuration | DNSSEC Validation, Keys & Signature Analysis Tool
- DMARC Policy & Configuration | DMARC Record Analysis Tool
- PageRank | Open PageRank Domain Ranking Tool
Phishing Check | URL Threat Inspection
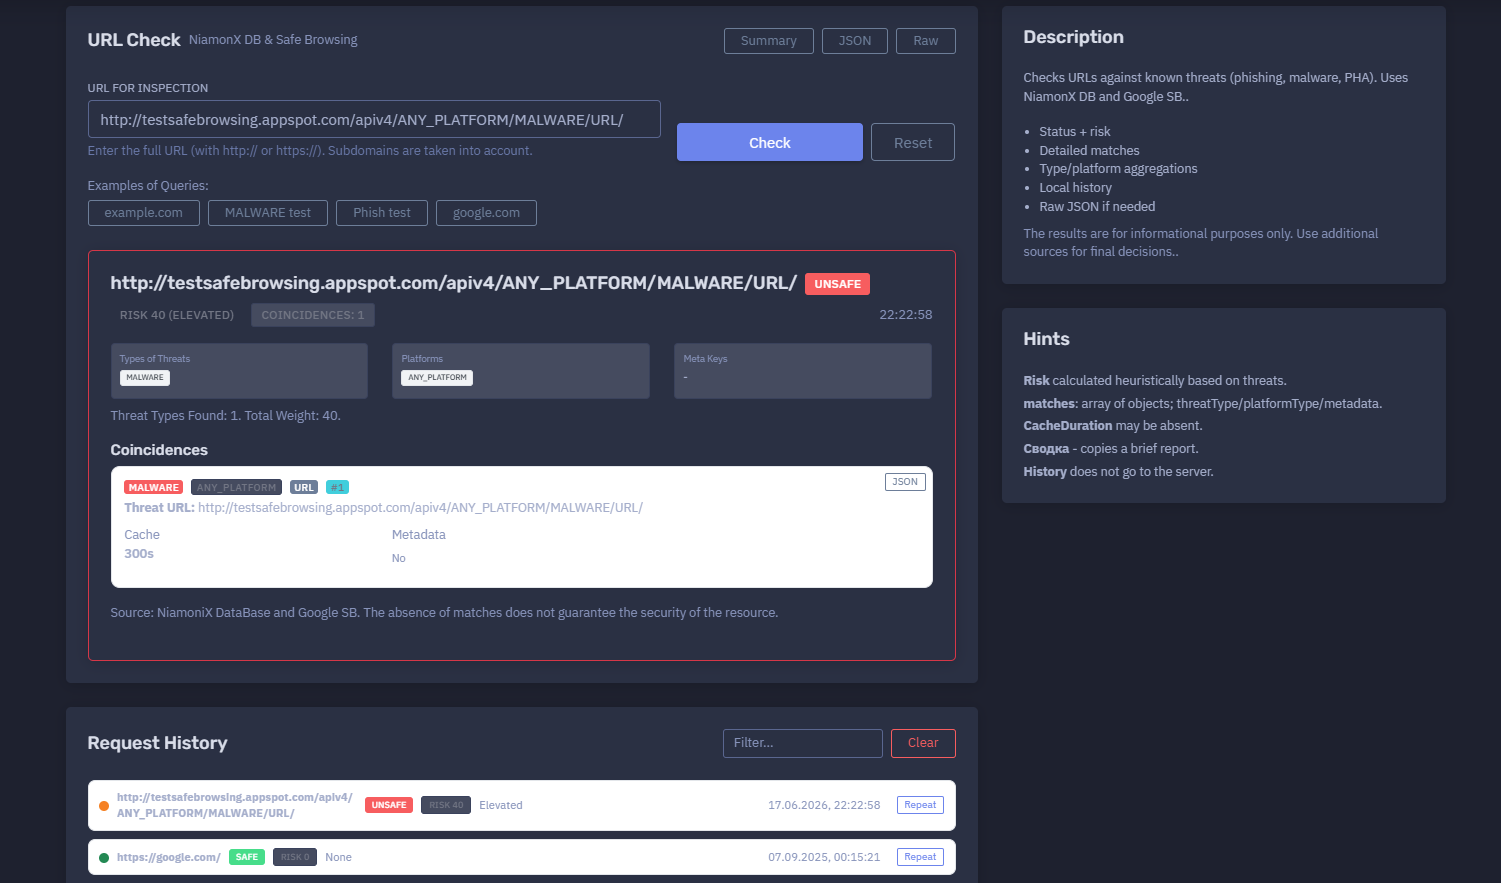
The platform available at https://dash.niamonx.io/phishing_check — known as Phishing Check — is a URL threat inspection tool within the NiamonX platform. It checks submitted URLs against known phishing, malware, unwanted software, and social engineering indicators using NiamonX threat intelligence data and Google Safe Browsing signals.
Overview of the Service
Phishing Check helps users quickly evaluate whether a URL appears in known threat datasets.
The tool is designed for cybersecurity analysts, SOC teams, incident responders, fraud investigators, compliance teams, brand protection specialists, and general users who need to inspect suspicious links before opening, sharing, or escalating them.
Phishing Check returns a structured result that includes:
-
Safety status
-
Risk score
-
Risk level
-
Threat type matches
-
Platform matches
-
Match count
-
Threat URL
-
Cache information
-
Metadata availability
-
Source information
-
Local browser request history
-
Raw JSON when needed
The tool is informational. A SAFE result does not guarantee that the resource is harmless, and an UNSAFE result should be validated with additional sources before high-impact decisions.
🔍 How the Tool Works
The user enters a full URL, including protocol.
Example:
https://example.com/
or:
http://testsafebrowsing.appspot.com/apiv4/ANY_PLATFORM/MALWARE/URL/
The tool checks the URL against threat intelligence sources, including:
-
NiamonX Database
-
Google Safe Browsing signals
The system then returns a result such as:
-
SAFE
-
UNSAFE
-
Unknown / no matches
-
Error or unavailable, depending on backend response
If matches are found, the tool displays threat type, affected platform, match details, risk score, and cache information.
🧩 What Can Be Checked
Phishing Check accepts full URLs.
Supported input format:
http://example.com/path
https://sub.example.com/login
The URL must include:
-
http:// -
or
https://
Subdomains are taken into account during inspection.
Unsupported or invalid inputs:
example.com
sub.example.com/login
1.1.1.1
just-text
For accurate inspection, users should paste the complete URL exactly as received.
⚙️ Interface Structure
The Phishing Check interface contains several main areas.
URL for Inspection
The input field where the user enters the full URL.
Example:
https://example.com/
The interface reminds users to enter the full URL with http:// or https://.
Examples of Queries
The interface may provide example URLs for testing safe browsing behavior or known test patterns.
Result Panel
The result panel displays:
-
Safety status
-
Risk score
-
Risk level
-
Match count
-
Timestamp
-
Threat types
-
Platforms
-
Metadata keys
-
Detailed coincidences
-
Cache duration
-
Source
Request History
The request history stores previous URL checks locally in the browser.
📊 Result Status
The main result status indicates whether the submitted URL matched known threat intelligence data.
Common statuses:
| Status | Meaning |
|---|---|
| SAFE | No known threat match was found |
| UNSAFE | One or more threat matches were found |
| UNKNOWN | The result could not be clearly determined |
| ERROR | The check failed or backend response was unavailable |
Example unsafe result:
UNSAFE
Risk 40
Elevated
Coincidences: 1
Example safe result:
SAFE
Risk 0
None
A safe result should not be interpreted as a guarantee of security. It means the URL did not match the known threat sources used for that check.
🚦 Risk Score
The tool calculates a heuristic risk score based on detected threats.
Example:
Risk 40 (Elevated)
Risk score may consider:
-
Threat type
-
Number of matches
-
Source confidence
-
Platform type
-
Metadata indicators
-
Threat weight
-
Known malicious classification
Example interpretation:
| Risk Level | Meaning |
|---|---|
| None | No known threat match |
| Low | Weak or limited indicators |
| Elevated | Known threat match or moderate risk |
| High | Strong threat evidence |
| Critical | Severe or multiple high-confidence indicators |
The exact score is calculated by the platform’s internal heuristic logic.
🧬 Threat Types
The Types of Threats section lists the threat categories found for the URL.
Possible threat types may include:
Example:
Types of Threats
MALWARE
Threat type helps analysts understand the nature of the risk.
Malware
The URL may be associated with malware delivery, payload hosting, infection chains, or malicious downloads.
Social Engineering / Phishing
The URL may be associated with credential theft, impersonation, fake login pages, payment fraud, or deceptive content.
Potentially Harmful Application
The URL may be associated with harmful applications or mobile threats.
🖥️ Platform Types
The Platforms section shows which platform category the threat applies to.
Example:
ANY_PLATFORM
Possible platform values may include:
-
ANY_PLATFORM
-
WINDOWS
-
LINUX
-
OSX
-
ANDROID
-
IOS
-
CHROME
-
Other backend-supported platform categories
ANY_PLATFORM means the threat is not limited to a specific operating system or device type.
🎯 Coincidences / Matches
The Coincidences section displays detailed matches returned by the threat intelligence check.
A match may include:
| Field | Description |
|---|---|
| Threat type | Malware, phishing, social engineering, or other category |
| Platform | Affected platform category |
| Entry type | URL or other supported indicator type |
| Threat URL | URL that matched threat intelligence |
| Metadata | Additional threat details, if available |
| Cache | Cache duration, when returned |
Example match:
Threat Type: Malware
Platform: ANY_PLATFORM
Entry Type: URL
Threat URL: http://example.test/malware/
The match details help analysts understand exactly what triggered the unsafe classification.
🧾 Metadata
The metadata section indicates whether additional metadata was returned.
Example:
Metadata: No
When metadata is available, it may contain additional context such as:
-
Threat labels
-
Provider-specific attributes
-
Match properties
-
Threat confidence
-
Campaign indicators
-
Source-specific fields
Metadata availability depends on the backend source and threat type.
🕒 Cache
The tool may show cache duration for the result.
Example:
Cache: 300s
Cache duration means the result may be reused for a short period to reduce repeated lookups and improve performance.
Important notes:
-
Cached results may not reflect the very latest reputation state.
-
A URL’s reputation can change quickly.
-
Repeat checks may use cached data until the cache expires.
-
Cache duration may be absent in some responses.
🧾 Raw JSON
The tool can provide Raw JSON when needed.
Raw JSON may include:
-
Result status
-
Risk score
-
Risk level
-
Threat matches
-
Threat type
-
Platform type
-
Metadata fields
-
Cache duration
-
Source indicators
-
Backend response details
Raw JSON is useful for:
-
SOC workflows
-
Case management
-
Automation
-
Evidence preservation
-
Incident response
-
Threat intelligence pipelines
-
Internal reporting
Raw output should be handled carefully when it contains suspicious URLs, investigation notes, or threat indicators.
🕓 Request History
Phishing Check stores URL check history locally in the browser.
History entries may include:
-
URL
-
Safety status
-
Risk score
-
Risk level
-
Timestamp
Example history item:
https://example.com/
SAFE
Risk 0
None
Important privacy behavior:
History does not go to the server.
Local history is useful for repeating checks and reviewing past inspections.
Because the history is browser-local, it may be cleared when users delete browser data or switch devices.
🧠 Key Features
URL Threat Check
Checks full URLs against known threat indicators.
NiamonX Database
Uses NiamonX threat intelligence data.
Google Safe Browsing Signals
Uses Google Safe Browsing-style threat classifications.
Status and Risk
Shows SAFE / UNSAFE status, risk score, and risk level.
Detailed Matches
Displays threat type, platform type, entry type, and matched threat URL.
Aggregations
Shows threat type and platform aggregations.
Cache Awareness
Displays cache duration when available.
Metadata Support
Shows metadata when returned by the backend.
Local History
Stores previous URL checks locally in the browser.
Raw JSON
Provides structured technical data for advanced review.
Summary Copy
Allows copying a brief report for sharing or documentation.
🔎 Common Use Cases
Phishing Check can support many defensive workflows.
Suspicious Link Review
Check a URL before opening it.
SOC Triage
Inspect URLs from alerts, emails, chat messages, endpoint logs, or proxy logs.
Phishing Investigation
Confirm whether a URL is associated with social engineering or credential theft.
Malware URL Review
Check whether a link is associated with malware delivery.
User Report Validation
Analyze URLs reported by employees or customers.
Brand Protection
Check suspicious domains or URLs impersonating a company.
Incident Response
Document known malicious URLs during security incidents.
Email Security Review
Inspect links extracted from suspicious messages.
Threat Intelligence Enrichment
Add URL reputation information to internal cases or watchlists.
⚠️ Result Interpretation
Phishing Check results should be interpreted carefully.
Important points:
-
Absence of matches does not guarantee that a URL is safe.
-
New phishing pages may not yet appear in threat databases.
-
A safe result may become unsafe later.
-
An unsafe result should be validated if it will be used for legal, HR, or customer-facing action.
-
URL reputation can vary by path, subdomain, and query string.
-
Subdomains are taken into account.
-
Shortened links should be expanded and checked carefully.
-
Cache may temporarily return a previous result.
-
Some malicious pages show different content by region, device, browser, or time.
-
A URL may redirect after inspection.
For high-risk cases, combine Phishing Check with sandbox analysis, DNS review, WHOIS, certificate inspection, HTTP header review, screenshot analysis, and endpoint telemetry.
✅ Recommended Analyst Workflow
A practical phishing review workflow should follow these steps.
1. Copy the Full URL
Include the full http:// or https:// URL exactly as received.
2. Run the Check
Submit the URL for inspection.
3. Review Status
Check whether the result is SAFE or UNSAFE.
4. Review Risk Score
Use risk score and level for triage.
5. Check Threat Types
Identify whether the match is malware, phishing, social engineering, or another category.
6. Review Platform Types
Check whether the threat is platform-specific or applies to any platform.
7. Inspect Coincidences
Review detailed match objects and threat URL.
8. Copy Summary
Use the summary copy function for tickets or incident reports.
9. Use Raw JSON When Needed
Open Raw JSON for automation, evidence, or deeper analysis.
10. Validate With Additional Sources
Use multiple security sources before making final decisions.
🛡️ Security, Privacy & Responsible Use
Phishing Check is intended for lawful cybersecurity, fraud prevention, incident response, and URL safety analysis.
Acceptable use cases include:
-
Checking suspicious URLs
-
Investigating phishing reports
-
SOC alert triage
-
Malware link review
-
Email security analysis
-
Brand protection
-
Threat intelligence enrichment
-
Incident documentation
-
User safety checks
Users should follow responsible use rules:
-
Do not open suspicious URLs directly in a normal browser.
-
Do not submit private tokens, session URLs, or sensitive internal links unless authorized.
-
Do not use results as the only source for high-impact decisions.
-
Do not weaponize threat data for phishing, malware distribution, or social engineering.
-
Validate malicious classifications before public reporting.
-
Treat URL history as potentially sensitive on shared devices.
-
Use safe environments when investigating live malicious content.
⚙️ Technical Highlights
-
URL threat inspection tool
-
Available at
dash.niamonx.io/phishing_check -
Requires full URL with
http://orhttps:// -
Subdomains are taken into account
-
Uses NiamonX Database
-
Uses Google Safe Browsing signals
-
Detects known threats such as phishing, malware, social engineering, and PHA
-
Displays SAFE / UNSAFE status
-
Calculates heuristic risk score
-
Displays risk level
-
Shows threat type aggregation
-
Shows platform aggregation
-
Shows detailed match objects
-
Shows matched threat URL
-
Shows cache duration when available
-
Shows metadata when available
-
Supports Raw JSON
-
Supports brief summary copying
-
Stores request history locally in browser
-
History is not sent to server
-
Suitable for SOC triage, phishing investigation, malware URL review, and threat intelligence workflows
📌 Usage Hints
-
Enter the full URL with
http://orhttps://. -
Include the exact suspicious path when possible.
-
Subdomains are included in the inspection.
-
Risk is calculated heuristically based on threats.
-
matchesmay includethreatType,platformType, and metadata. -
CacheDurationmay be absent. -
A SAFE result does not guarantee that the resource is safe.
-
Use additional sources for final decisions.
-
Use summary copy for quick reports.
-
Use Raw JSON for technical workflows.
-
Local history stays in the browser and is not sent to the server.
-
Avoid opening suspicious URLs outside a safe environment.
📬 Contact Information
For technical, legal, abuse, privacy, or support-related inquiries, users can contact the NiamonX team directly:
support@niamonx.io — Technical Support
other@niamonx.io — General Inquiries
takedown@niamonx.io — Privacy or Data Removal Requests
legal@niamonx.io — Legal and Compliance Matters
Alternative contact channel:
🔗 Helpdesk: https://support.niamonx.io/
Summary
NiamonX Phishing Check is a URL threat inspection tool that checks full URLs against NiamonX Database and Google Safe Browsing signals.
It returns SAFE / UNSAFE status, heuristic risk score, risk level, threat types, platform types, detailed matches, cache information, metadata, local history, summary copy, and Raw JSON.
The tool is designed for phishing investigation, malware URL review, SOC triage, brand protection, incident response, email security analysis, and threat intelligence enrichment. Results are informational and should be validated with additional sources before final decisions.
Host Diagnostics | Multi-Protocol Network Diagnostic Tool
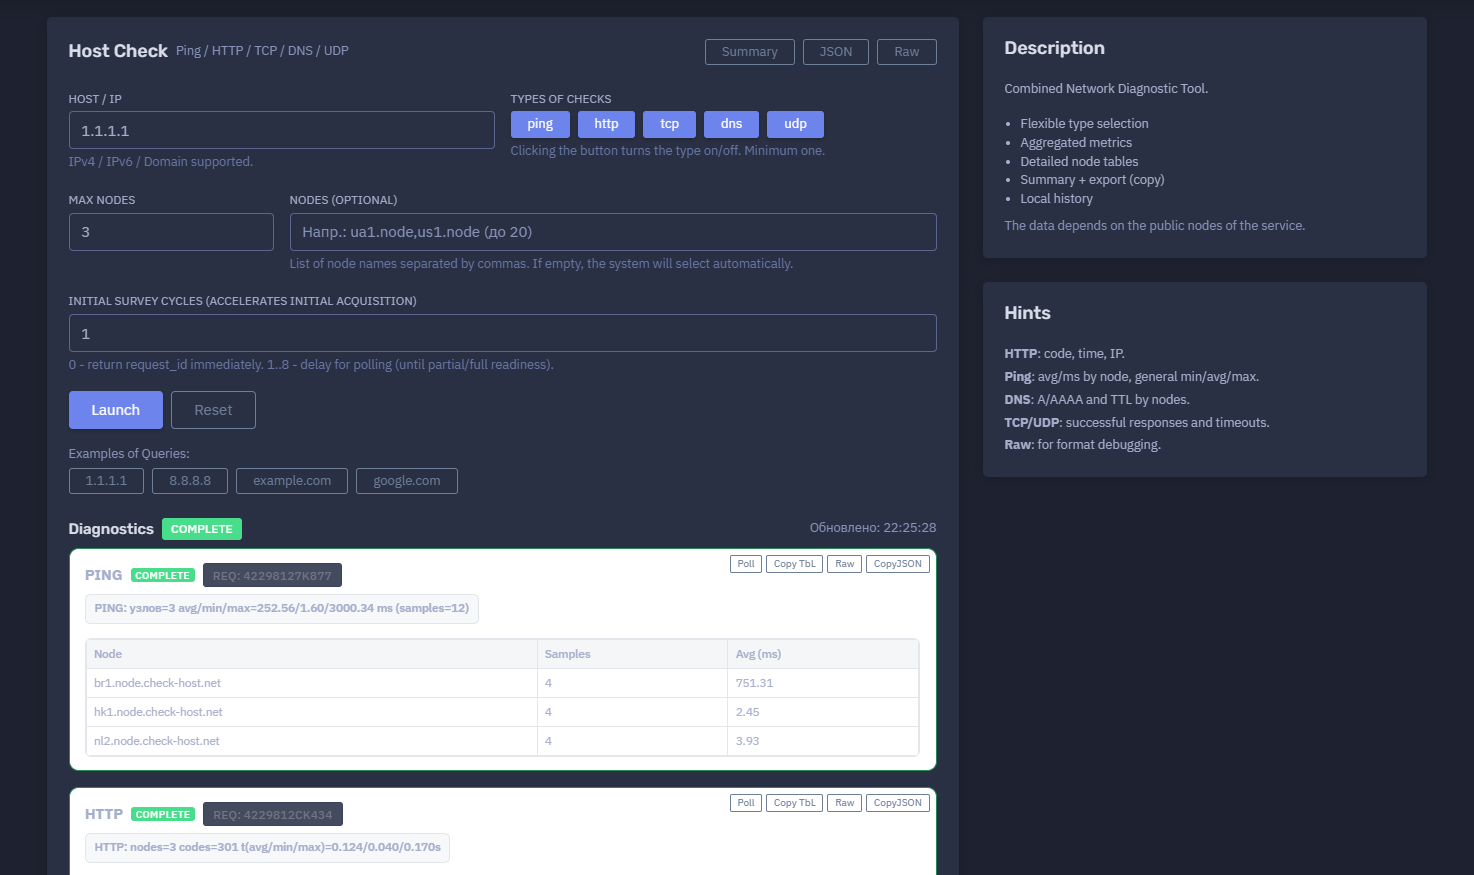
The platform available at https://dash.niamonx.io/host_diagnostics — known as Host Diagnostics — is a combined network diagnostic tool within the NiamonX platform. It allows users to check a host, IP address, or domain across multiple network layers using Ping, HTTP, TCP, DNS, and UDP diagnostics from distributed public nodes.
Overview of the Service
Host Diagnostics is designed to provide a structured, multi-protocol view of host availability and network behavior.
Unlike a single ping or DNS lookup, this tool performs several types of checks in one workflow. It can verify whether a target responds to ICMP-style ping checks, whether HTTP is reachable, whether TCP connectivity works, whether DNS resolution is available, and whether UDP responses are received from selected diagnostic nodes.
The tool is useful for:
-
Network troubleshooting
-
Website availability checks
-
Infrastructure diagnostics
-
SOC and incident response workflows
-
DevOps and uptime analysis
-
DNS and routing validation
-
Regional connectivity review
-
Firewall and filtering checks
-
Basic service reachability testing
-
External monitoring from multiple nodes
The data depends on public diagnostic nodes used by the service. Results should be treated as network diagnostics and validated with additional tools for critical infrastructure decisions.
🔍 How the Tool Works
The user enters a target host, IP address, or domain and selects one or more diagnostic check types.
Supported target types:
-
IPv4 address
-
IPv6 address
-
Domain name
-
Hostname
Supported check types:
-
Ping
-
HTTP
-
TCP
-
DNS
-
UDP
At least one check type must be enabled. The user can also define how many diagnostic nodes should be used and optionally specify node names manually.
After the request is submitted, the backend starts one or more diagnostic jobs. Each selected check type receives its own request ID and progresses independently until it reaches a final state such as complete, partial, failed, or timeout.
The final result is displayed as a combined diagnostic report with aggregated metrics and detailed node tables.
🧩 What Can Be Checked
Host Diagnostics supports three main categories of targets.
IPv4 Address
Example:
1.1.1.1
IPv6 Address
Example:
2606:4700:4700::1111
Domain or Hostname
Example:
niamonx.io
api.example.com
The tool should not be used with full URLs, paths, or query strings unless a specific check type supports that behavior. For best results, users should enter only the clean host, IP, or domain.
⚙️ Diagnostic Interface
The interface includes several key controls.
Host / IP
The main input field where the user enters the target.
Example:
1.1.1.1
Supported formats:
-
IPv4
-
IPv6
-
Domain
-
Hostname
Types of Checks
Users can enable or disable diagnostic types by clicking the corresponding buttons.
Available checks:
-
Ping
-
HTTP
-
TCP
-
DNS
-
UDP
At least one type must remain selected.
Max Nodes
Controls how many nodes should be used for each check.
Example:
Max nodes: 3
Using more nodes provides broader geographic visibility but may increase processing time.
Nodes Optional
Users can optionally specify node names manually.
Example format:
ua1.node,us1.node
Up to 20 node names may be entered as a comma-separated list, depending on backend limits.
If the field is empty, the system selects nodes automatically.
Initial Survey Cycles
Controls whether the request should return immediately with a request ID or wait briefly for partial or full readiness.
Example:
Initial survey cycles: 1
Interpretation:
| Value | Meaning |
|---|---|
| 0 | Return request ID immediately |
| 1–8 | Wait for polling until partial or full readiness |
This option can make the first response more useful by allowing the backend to collect initial data before returning results.
📊 Combined Diagnostics Status
The main diagnostics panel displays the global status of the selected checks.
Example:
Diagnostics
COMPLETE
Updated: 22:25:28
Possible status values may include:
| Status | Meaning |
|---|---|
| COMPLETE | All selected checks reached a final completed state |
| PARTIAL | Some checks or nodes returned results, while others did not |
| RUNNING | Checks are still in progress |
| FAILED | The diagnostic job failed |
| TIMEOUT | The check did not complete within the expected time |
| ERROR | Backend or parsing error occurred |
A complete status means the requested checks finished, not necessarily that every service responded successfully.
🛰️ Node-Based Diagnostics
Host Diagnostics uses external nodes to test the target from different network locations.
Each node may return different results because of:
-
Geographic routing
-
Firewall rules
-
DNS differences
-
CDN behavior
-
Anycast behavior
-
Regional filtering
-
Network congestion
-
Provider outages
-
IPv4 / IPv6 availability
-
Target-side rate limiting
Node-based diagnostics are especially useful when a host works from one region but fails from another.
📡 Ping Check
The Ping check measures basic network reachability and latency.
Example summary:
PING: nodes=3 avg/min/max=252.56/1.60/3000.34 ms samples=12
The Ping section may include:
-
Request ID
-
Number of nodes
-
Average RTT
-
Minimum RTT
-
Maximum RTT
-
Number of samples
-
Per-node average latency
Example table:
| Node | Samples | Avg ms |
|---|---|---|
| br1.node.check-host.net | 4 | 751.31 |
| hk1.node.check-host.net | 4 | 2.45 |
| nl2.node.check-host.net | 4 | 3.93 |
Ping Interpretation
Ping is useful for checking:
-
Basic availability
-
Network latency
-
Packet-level reachability
-
Regional routing differences
-
Possible filtering or packet loss
High ping values may indicate long-distance routing, congestion, packet loss, or regional network problems.
A failed ping does not always mean the host is down. Some hosts block ICMP-style traffic while still serving HTTP, TCP, or DNS normally.
🌐 HTTP Check
The HTTP check verifies whether the target responds over HTTP or HTTPS-style web checks, depending on backend behavior.
Example summary:
HTTP: nodes=3 codes=301 t(avg/min/max)=0.124/0.040/0.170s
The HTTP section may include:
-
Request ID
-
HTTP status codes
-
Average response time
-
Minimum response time
-
Maximum response time
-
Node-level status
-
Resolved IP used by the node
Example table:
| Node | Code | Status | Time s | IP |
|---|---|---|---|---|
| ir5.node.check-host.net | 301 | Moved Permanently | 0.164 | 1.1.1.1 |
| ir7.node.check-host.net | 301 | Moved Permanently | 0.170 | 1.1.1.1 |
| si1.node.check-host.net | 301 | Moved Permanently | 0.040 | 1.1.1.1 |
HTTP Interpretation
HTTP diagnostics are useful for checking:
-
Web availability
-
HTTP status codes
-
Redirect behavior
-
Response time
-
Regional web reachability
-
Basic CDN or proxy behavior
Common HTTP codes:
| Code | Meaning |
|---|---|
| 200 | OK |
| 301 | Moved Permanently |
| 302 | Found / temporary redirect |
| 403 | Forbidden |
| 404 | Not Found |
| 500 | Server error |
| 502 / 503 / 504 | Gateway or service availability problem |
A successful HTTP response does not always mean the application is healthy. It only confirms that an HTTP-level response was returned.
🔌 TCP Check
The TCP check tests whether a TCP connection can be established.
Example summary:
TCP: success=3/3 t=0.004/0.001/0.010s
The TCP section may include:
-
Request ID
-
Number of successful nodes
-
Total nodes
-
Average / minimum / maximum connection time
-
Per-node result
-
Per-node response time
Example table:
| Node | Status | Time s |
|---|---|---|
| ae1.node.check-host.net | OK | 0.010 |
| es1.node.check-host.net | OK | 0.002 |
| in3.node.check-host.net | OK | 0.001 |
TCP Interpretation
TCP checks are useful for verifying:
-
Port-level reachability
-
Firewall behavior
-
Regional blocking
-
Service availability
-
Connection establishment time
-
Basic network path health
A successful TCP check means the node could establish a connection. It does not necessarily validate the full application protocol.
🧭 DNS Check
The DNS check verifies DNS resolution from selected diagnostic nodes.
Example summary:
DNS: nodes=3 A=0 AAAA=0 TTL(min/max)=1001/1523
The DNS section may include:
-
Request ID
-
Number of nodes
-
A records
-
AAAA records
-
TTL values
-
Per-node DNS results
Example table:
| Node | A | AAAA | TTL |
|---|---|---|---|
| nl1.node.check-host.net | - | - | 1523 |
| nl2.node.check-host.net | - | - | 1509 |
| rs1.node.check-host.net | - | - | 1001 |
DNS Interpretation
DNS diagnostics are useful for:
-
Checking whether a domain resolves globally
-
Comparing A / AAAA responses by node
-
Identifying TTL differences
-
Diagnosing DNS propagation
-
Detecting resolver-specific failures
-
Validating CDN or GeoDNS behavior
If the target is an IP address rather than a domain, DNS results may be limited or empty depending on backend behavior.
📦 UDP Check
The UDP check attempts UDP-level diagnostics from selected nodes.
Example summary:
UDP: answers=0/3 0.0% timeouts=3
The UDP section may include:
-
Request ID
-
Number of answers
-
Total nodes
-
Answer percentage
-
Timeout count
-
Per-node result
Example table:
| Node | Result |
|---|---|
| bg1.node.check-host.net | Timeout |
| pt1.node.check-host.net | Timeout |
| rs1.node.check-host.net | Timeout |
UDP Interpretation
UDP diagnostics are useful for checking:
-
UDP responsiveness
-
Firewall behavior
-
Timeout patterns
-
Regional UDP filtering
-
Service exposure
-
DNS, VPN, VoIP, gaming, or other UDP-based behavior
UDP is connectionless, so timeouts are common and may not always indicate failure. Many services do not respond to generic UDP probes.
📋 Aggregated Metrics
Host Diagnostics provides summaries for each check type.
Examples:
PING: avg/min/max
HTTP: status codes and response time
TCP: success rate and connection time
DNS: A/AAAA and TTL
UDP: answers and timeouts
Aggregated metrics help analysts quickly identify which layer is failing.
For example:
-
Ping fails but HTTP works: ICMP may be blocked.
-
DNS fails but TCP works by IP: DNS problem likely.
-
HTTP fails but TCP works: application or web-layer issue.
-
TCP fails from some nodes only: regional filtering or routing issue.
-
UDP times out everywhere: UDP service may be closed, filtered, or non-responsive.
🧾 Request IDs
Each check type may receive its own request ID.
Example:
Req: 42298127k877
Request IDs help track individual diagnostic jobs and are useful when polling, debugging, or comparing results.
🧪 Initial Survey Cycles
The Initial survey cycles setting controls how quickly the initial response is returned.
0 Cycles
The tool returns the request ID immediately.
This is useful for asynchronous workflows where the user or interface will poll later.
1–8 Cycles
The tool waits briefly for partial or complete readiness before returning the result.
This can speed up the user experience because initial data may already be available when the result appears.
🧠 Key Features
Combined Network Diagnostics
Runs Ping, HTTP, TCP, DNS, and UDP checks from one interface.
Flexible Type Selection
Users can enable or disable check types as needed.
Multi-Node Testing
Checks can run from several public diagnostic nodes.
Automatic Node Selection
If no nodes are specified, the system selects nodes automatically.
Manual Node Selection
Advanced users can specify node names manually.
Aggregated Metrics
Each check type includes summarized performance and availability data.
Detailed Node Tables
Per-node results show regional differences and diagnostic details.
Summary Copy
The tool can provide a copyable summary for reports or tickets.
Export Support
Diagnostic results can be copied or exported for documentation.
Local History
Previous checks are stored locally in the browser.
Raw Output
Raw data can be used for format debugging and deeper troubleshooting.
🕓 Request History
The Request History section stores previous diagnostic checks locally in the browser.
History entries may include:
-
Target host or IP
-
Selected check types
-
Result status
-
Timestamp
Example history item:
1.1.1.1
dns,http,ping,tcp,udp
OK
17.06.2026, 22:25:28
Possible history statuses:
| Status | Meaning |
|---|---|
| OK | Diagnostic completed successfully |
| PART | Partial result |
| FAIL | Failed result |
| ERROR | Error occurred |
Local history helps repeat previous diagnostics and compare results over time.
Because it is stored in the browser, it may be cleared when users delete browser data or switch devices.
🔧 Raw Output
The tool may provide raw output for format debugging.
Raw data can help developers and analysts understand:
-
Backend response structure
-
Node-level payloads
-
Timing fields
-
Status fields
-
Partial responses
-
Formatting issues
-
Parsing behavior
Raw output is useful for technical troubleshooting but should not be necessary for normal users.
✅ Recommended Diagnostic Workflow
A practical host diagnostic workflow should follow these steps.
1. Enter the Target
Use an IPv4 address, IPv6 address, domain, or hostname.
2. Select Check Types
Enable Ping, HTTP, TCP, DNS, UDP, or only the checks relevant to the issue.
3. Set Max Nodes
Use 3 nodes for quick checks or more nodes for broader regional diagnostics.
4. Specify Nodes If Needed
Enter node names manually when testing from specific regions.
5. Choose Initial Survey Cycles
Use 1 for a balanced interactive result or 0 for immediate request ID return.
6. Review Global Status
Check whether the overall result is complete, partial, failed, or still running.
7. Analyze Each Layer
Review Ping, HTTP, TCP, DNS, and UDP independently.
8. Compare Nodes
Look for regions where one node fails while others succeed.
9. Identify the Failing Layer
Use differences between protocols to isolate DNS, web, TCP, UDP, or routing problems.
10. Copy or Export Results
Use summaries for incident tickets, reports, or support communication.
🔎 Common Use Cases
Host Diagnostics can support many technical workflows.
Website Availability Check
Use HTTP and DNS checks to confirm whether a website is reachable.
Network Reachability Check
Use Ping and TCP checks to verify basic connectivity.
DNS Propagation Review
Use DNS checks across nodes to compare A, AAAA, and TTL values.
Firewall Troubleshooting
Compare TCP / UDP / Ping behavior to identify filtering.
Incident Response
Quickly determine whether a target is globally down or regionally affected.
DevOps Monitoring
Use repeated diagnostics to investigate deployment, DNS, or routing issues.
SOC Triage
Check suspicious hosts or infrastructure indicators from multiple layers.
Regional Connectivity Analysis
Use node-level results to identify geographic network problems.
⚠️ Result Interpretation Notes
Host Diagnostics results should be interpreted carefully.
Important limitations:
-
Public nodes may have their own outages or restrictions.
-
A failed ping does not always mean the service is down.
-
HTTP checks may follow redirects or return expected non-200 statuses.
-
TCP success does not prove application health.
-
DNS results may vary by resolver, cache, or geography.
-
UDP timeouts are common and not always a failure.
-
Some targets block diagnostic nodes.
-
Results can be partial while some checks are still updating.
-
Different nodes may see different network paths.
-
Data depends on public nodes of the service.
For production incidents, combine Host Diagnostics with server logs, application monitoring, traceroute, firewall logs, DNS provider dashboards, and cloud provider status pages.
🛡️ Security, Privacy & Responsible Use
Host Diagnostics is intended for lawful network diagnostics, troubleshooting, uptime checks, incident response, and infrastructure analysis.
Acceptable use cases include:
-
Checking your own infrastructure
-
Troubleshooting website downtime
-
Validating DNS resolution
-
Testing TCP connectivity
-
Reviewing UDP reachability
-
Supporting incident response
-
Comparing regional network behavior
-
Preparing support tickets
-
SOC enrichment of network indicators
-
DevOps and monitoring workflows
Users should follow responsible use principles:
-
Do not use the tool to harass or overload third-party infrastructure.
-
Do not repeatedly test systems without a legitimate reason.
-
Do not interpret diagnostic failures as proof of malicious activity.
-
Do not rely on one check type for critical conclusions.
-
Validate important findings with additional sources.
-
Treat local history as potentially sensitive on shared devices.
-
Use the tool only for lawful and ethical diagnostics.
⚙️ Technical Highlights
-
Combined network diagnostic tool
-
Available at
dash.niamonx.io/host_diagnostics -
Supports IPv4
-
Supports IPv6
-
Supports domains and hostnames
-
Check types: Ping, HTTP, TCP, DNS, UDP
-
Minimum one check type required
-
Flexible check type selection
-
Max nodes control
-
Optional manual node list
-
Automatic node selection
-
Initial survey cycles for faster initial acquisition
-
Per-check request IDs
-
Aggregated metrics
-
Detailed node tables
-
Ping avg / min / max and samples
-
HTTP status code, status text, time, and IP
-
TCP success rate and connection time
-
DNS A / AAAA and TTL by node
-
UDP answer rate and timeouts
-
Combined diagnostics status
-
Summary copy
-
Export support
-
Local browser request history
-
Raw output for debugging
-
Suitable for network diagnostics, SOC, DevOps, incident response, and infrastructure monitoring
📌 Usage Hints
-
Enter an IPv4 address, IPv6 address, domain, or hostname.
-
Select at least one check type.
-
Use Ping for latency and basic reachability.
-
Use HTTP for web status, response time, and resolved IP.
-
Use TCP for connection-level availability.
-
Use DNS for A / AAAA and TTL comparison.
-
Use UDP for UDP response and timeout checks.
-
Use more nodes for broader regional visibility.
-
Leave the node list empty for automatic selection.
-
Use manual nodes when testing from specific regions.
-
Set initial survey cycles to
0if you need the request ID immediately. -
Use Raw output for format debugging.
-
Remember that public node availability affects results.
-
Store copied diagnostics securely when used in incident reports.
📬 Contact Information
For technical, legal, abuse, privacy, or support-related inquiries, users can contact the NiamonX team directly:
support@niamonx.io — Technical Support
other@niamonx.io — General Inquiries
takedown@niamonx.io — Privacy or Data Removal Requests
legal@niamonx.io — Legal and Compliance Matters
Alternative contact channel:
🔗 Helpdesk: https://support.niamonx.io/
Summary
NiamonX Host Diagnostics is a combined multi-protocol network diagnostic tool for checking IPv4 addresses, IPv6 addresses, domains, and hostnames across Ping, HTTP, TCP, DNS, and UDP layers.
It supports flexible check selection, multi-node testing, automatic or manual node selection, initial survey cycles, per-check request IDs, aggregated metrics, node-level tables, summary copy, export support, local browser history, and raw output for debugging.
The tool is designed for network troubleshooting, DevOps workflows, SOC triage, incident response, website availability checks, DNS diagnostics, firewall validation, and regional connectivity analysis. Results should be interpreted as diagnostic signals and validated with additional monitoring sources for critical decisions.
Domain WHOIS Checker | WHOIS / RDAP Domain Intelligence
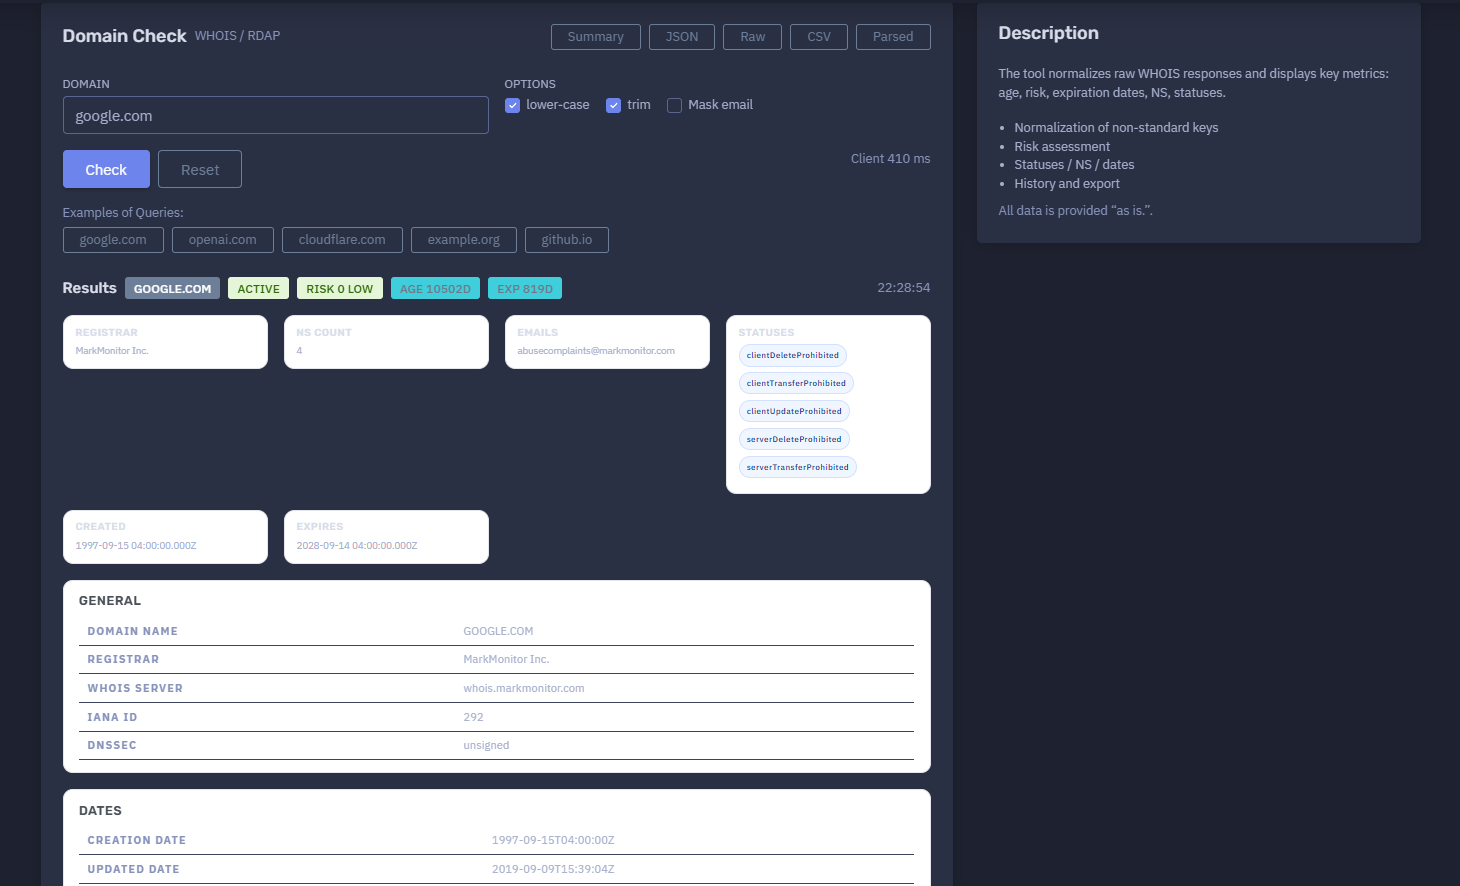
The platform available at https://dash.niamonx.io/domain_whois — known as Domain WHOIS Checker — is a domain intelligence and registration analysis tool within the NiamonX platform. It allows users to check WHOIS / RDAP information for a domain name, normalize raw registry responses, extract key ownership and registration fields, assess domain risk, and review domain age, expiration, registrar, name servers, statuses, abuse contacts, and parsed technical data.
Overview of the Service
Domain WHOIS Checker is designed to help users quickly understand the registration profile of a domain.
The tool collects and normalizes WHOIS / RDAP-style data and displays it in a clean, structured format. Instead of forcing the user to manually read raw WHOIS text, the system extracts the most important fields and presents them as a readable domain report.
The module is useful for:
-
SOC triage
-
OSINT investigation
-
Domain reputation review
-
Phishing investigation
-
Brand protection
-
Abuse reporting
-
Infrastructure analysis
-
Compliance checks
-
Threat intelligence enrichment
-
Domain lifecycle monitoring
-
Security research
The tool displays domain status, registrar, WHOIS server, IANA registrar ID, DNSSEC status, creation date, update date, expiration date, name servers, registry statuses, contact emails, raw WHOIS, extra text, and parsed JSON.
All data is provided “as is” and should be validated with official registrar or registry sources when used for critical decisions.
🔍 How the Tool Works
The user enters a domain name and selects optional normalization settings.
Example input:
google.com
The tool then performs a WHOIS / RDAP lookup and parses the returned response.
The result may include:
-
Domain name
-
Domain activity status
-
Risk score
-
Risk level
-
Domain age
-
Days until expiration
-
Registrar
-
WHOIS server
-
IANA ID
-
DNSSEC status
-
Creation date
-
Updated date
-
Expiration date
-
Name servers
-
Registry statuses
-
Abuse or contact emails
-
Raw WHOIS text
-
Extra WHOIS text
-
Parsed JSON
-
Local request history
The tool also calculates high-level metrics such as domain age and remaining expiration time, which help analysts quickly understand whether the domain appears newly registered, mature, expiring soon, or stable.
🧩 What Can Be Checked
Domain WHOIS Checker accepts domain names.
Valid examples:
google.com
cloudflare.com
niamonx.io
github.io
Invalid examples:
https://google.com
google.com/search
https://example.com/login
1.1.1.1
The tool is intended for domain names only. IP lookup, DNS resolution, reverse IP, ASN, and service intelligence are handled by separate NiamonX modules.
⚙️ Interface Structure
The Domain WHOIS Checker interface contains several main sections.
Domain
The input field where the user enters the domain name.
Example:
google.com
Options
The tool provides optional processing settings.
Available options may include:
-
lower-case
-
trim
-
Mask email
These options help normalize input and protect sensitive contact details in the displayed report.
Results
The result panel displays the normalized domain report.
General
The General section shows core WHOIS / RDAP fields.
Dates
The Dates section displays creation, update, and expiration timestamps.
Name Servers
The Name Servers section lists authoritative name servers returned by the registry or registrar.
Statuses
The Statuses section shows domain registry status flags.
Emails
The Emails section shows detected contact or abuse emails, depending on WHOIS availability and masking settings.
Raw WHOIS
Displays the original raw WHOIS response.
Extra Text
Displays additional unstructured text returned by the WHOIS source.
Parsed JSON
Displays the normalized structured representation of the WHOIS result.
Request History
Stores recent domain checks locally in the browser.
🛠️ Input Normalization Options
Domain WHOIS Checker includes options that help prepare and sanitize the input or output.
Lower-case
Converts the submitted domain to lowercase.
Example:
GOOGLE.COM → google.com
This improves consistency because domain names are case-insensitive in normal DNS usage.
Trim
Removes extra spaces before and after the domain.
Example:
google.com → google.com
This prevents accidental lookup errors caused by copied whitespace.
Mask Email
Masks or partially hides email addresses in the displayed result.
This is useful when:
-
Sharing screenshots
-
Preparing documentation
-
Publishing internal reports
-
Reducing exposure of abuse or contact addresses
-
Avoiding unnecessary display of personal or operational contact data
When full contact details are needed for an authorized workflow, users should handle them carefully.
📊 Result Summary
After a successful lookup, the tool displays a high-level summary.
Example structure:
google.com
Active
Risk 0 Low
Age 10502d
Exp 819d
Registrar: MarkMonitor Inc.
NS Count: 4
The summary helps users quickly understand:
-
Whether the domain appears active
-
Its calculated risk score
-
Its age in days
-
How many days remain until expiration
-
Which registrar manages it
-
How many name servers are configured
-
Whether emails or statuses were detected
🚦 Domain Status
The result may show a general domain state, such as:
Active
This means the domain appears to have valid registration data and is not obviously expired or unavailable in the returned WHOIS / RDAP response.
Possible domain states may include:
-
Active
-
Expired
-
Unknown
-
Suspended
-
Pending
-
Error / unavailable
The exact state depends on the registry data and parser output.
⚠️ Risk Score
Domain WHOIS Checker calculates a risk score and risk level.
Example:
Risk 0 Low
The risk score is an analytical indicator. It may consider factors such as:
-
Very new domain age
-
Expiration soon
-
Missing or unusual fields
-
Suspicious status combinations
-
Unusual registrar or WHOIS structure
-
Missing name servers
-
Domain lifecycle anomalies
-
Potentially risky registration patterns
-
Parser warnings
Risk score helps with triage, but it is not a final reputation verdict.
A low risk score does not guarantee that the domain is safe. A higher score does not automatically prove malicious activity.
📅 Domain Age
The Age metric shows how many days have passed since the domain creation date.
Example:
Age 10502d
Domain age is useful for reputation analysis.
General interpretation:
| Domain Age | Possible Interpretation |
|---|---|
| 0–30 days | Newly registered domain; review carefully |
| 31–180 days | Young domain; may require context |
| 181–365 days | Established but still relatively new |
| 1–5 years | More mature domain |
| 5+ years | Long-running domain, often lower registration-age risk |
Newly registered domains are often important in phishing, scam, malware, and impersonation investigations, but domain age alone is not proof of malicious activity.
⏳ Expiration Metric
The Exp metric shows how many days remain until the domain expiration date.
Example:
Exp 819d
Expiration data is useful for:
-
Domain lifecycle monitoring
-
Brand protection
-
Asset management
-
Security review
-
Detecting domains close to expiry
-
Preventing accidental domain loss
A domain close to expiration may represent operational risk if it belongs to an organization.
For suspicious domains, short expiration windows may indicate temporary infrastructure, but this must be interpreted with other signals.
🏢 Registrar Information
The Registrar field shows which registrar manages the domain registration.
Example:
Registrar: MarkMonitor Inc.
The General section may also show:
| Field | Description |
|---|---|
| Registrar | Registrar name |
| WHOIS Server | Registrar WHOIS server |
| IANA ID | Registrar identifier assigned by IANA |
| DNSSEC | DNSSEC status |
Example:
Whois Server: whois.markmonitor.com
IANA ID: 292
DNSSEC: unsigned
Registrar data is useful for:
-
Abuse reporting
-
Domain ownership context
-
Brand protection
-
Legal escalation
-
Investigating suspicious registrations
-
Validating domain management provider
🔐 DNSSEC Status
The DNSSEC field shows whether the domain has DNSSEC configured according to the returned data.
Example:
DNSSEC: unsigned
Possible values may include:
-
signed
-
unsigned
-
unknown
-
unavailable
DNSSEC helps protect DNS integrity by allowing cryptographic validation of DNS responses. However, lack of DNSSEC does not automatically mean a domain is malicious.
📅 Dates Section
The Dates section displays key lifecycle timestamps.
Common fields:
| Field | Description |
|---|---|
| Creation Date | When the domain was first registered |
| Updated Date | When the registration record was last updated |
| Expiration Date | When the domain is scheduled to expire |
Example:
Creation Date: 1997-09-15T04:00:00Z
Updated Date: 2019-09-09T15:39:04Z
Expiration Date: 2028-09-14T04:00:00Z
Creation Date
Useful for domain age analysis.
Updated Date
Useful for detecting recent registration changes, registrar transfers, DNS changes, or administrative updates.
Expiration Date
Useful for lifecycle monitoring and risk assessment.
🌐 Name Servers
The Name Servers section lists authoritative DNS servers for the domain.
Example:
NS1.GOOGLE.COM
NS2.GOOGLE.COM
NS3.GOOGLE.COM
NS4.GOOGLE.COM
Name servers are useful for:
-
Identifying DNS provider
-
Checking domain infrastructure
-
Detecting DNS migration
-
Reviewing hosting or CDN setup
-
Investigating suspicious domain clusters
-
Brand protection
-
Security audits
A sudden change in name servers may indicate migration, takeover, compromise, or operational change depending on context.
🏷️ Registry Statuses
Domain statuses show registry-level restrictions or lifecycle states.
Example statuses:
clientDeleteProhibited
clientTransferProhibited
clientUpdateProhibited
serverDeleteProhibited
serverTransferProhibited
serverUpdateProhibited
Common statuses include:
| Status | Meaning |
|---|---|
clientTransferProhibited |
Registrar-level transfer lock |
clientDeleteProhibited |
Registrar-level delete protection |
clientUpdateProhibited |
Registrar-level update restriction |
serverTransferProhibited |
Registry-level transfer restriction |
serverDeleteProhibited |
Registry-level delete restriction |
serverUpdateProhibited |
Registry-level update restriction |
ok |
Standard active state |
pendingDelete |
Domain is pending deletion |
redemptionPeriod |
Domain is in redemption period |
clientHold |
Domain may be prevented from resolving |
serverHold |
Registry-level hold |
Status codes help analysts understand domain protection, lifecycle, and administrative restrictions.
📧 Emails and Contacts
The tool extracts visible email addresses from the WHOIS / RDAP response when available.
Example:
abusecomplaints@example-registrar.com
Email fields may include:
-
Abuse contact
-
Registrar contact
-
Administrative contact
-
Technical contact
-
Generic WHOIS contact
Due to privacy rules and redaction practices, many WHOIS records no longer expose registrant personal email addresses.
If Mask email is enabled, emails may be hidden or partially masked in the interface.
Contact emails are useful for:
-
Abuse reports
-
Phishing takedown requests
-
Registrar escalation
-
Legal workflows
-
Security notifications
🧾 Raw WHOIS
The Raw WHOIS section displays the original unnormalized WHOIS response.
Raw WHOIS is useful when:
-
Parser output needs verification
-
Important fields are missing from the structured view
-
The registry uses unusual formatting
-
Analysts need exact source text
-
Legal or compliance workflows require raw evidence
-
Manual review is necessary
Raw WHOIS may contain unstructured text, registry disclaimers, contact fields, status lines, name servers, and timestamps.
📄 Extra Text
The Extra Text section displays additional unstructured content that may not fit into standard parsed fields.
This may include:
-
Registry disclaimers
-
Terms of use
-
Registrar notices
-
RDAP messages
-
Additional contact notes
-
Parser-unmapped fields
-
Legal text
Extra Text can be useful when investigating unusual registry responses.
🧬 Parsed JSON
The Parsed JSON section displays structured normalized data extracted from WHOIS / RDAP.
Parsed JSON may include:
-
Domain name
-
Registrar
-
WHOIS server
-
IANA ID
-
DNSSEC status
-
Dates
-
Name servers
-
Statuses
-
Emails
-
Raw text mapping
-
Risk values
-
Parser metadata
Parsed JSON is useful for:
-
API workflows
-
SOC automation
-
Case management
-
Evidence preservation
-
Technical documentation
-
Internal dashboards
-
Compliance reporting
🕓 Request History
The tool stores recent domain checks in the browser.
History entries may include:
-
Domain
-
Status
-
Risk score
-
Age
-
Expiration remaining days
-
Timestamp
Example history format:
google.com
active
R0
A:10502d
E:819d
17.06.2026, 22:28:54
History is useful for quickly repeating previous checks and comparing how domain age, expiration, and risk score change over time.
Because history is browser-local, it may be cleared when users delete browser data or switch devices.
🧠 Key Features
WHOIS / RDAP Lookup
Checks domain registration data using WHOIS / RDAP-style sources.
Normalization
Normalizes non-standard keys and inconsistent registry responses.
Risk Assessment
Calculates domain risk score and risk level.
Domain Age
Calculates how many days have passed since creation.
Expiration Tracking
Calculates how many days remain until expiration.
Registrar Information
Shows registrar, WHOIS server, and IANA ID.
DNSSEC Status
Displays DNSSEC signing state when available.
Name Server Extraction
Status Extraction
Displays registry and registrar status codes.
Email Extraction and Masking
Extracts contact emails and supports masking.
Raw WHOIS
Allows manual review of original response.
Parsed JSON
Provides structured technical data.
Request History
Stores recent checks locally in the browser.
Export Support
Supports history and result export workflows when available.
🔎 Common Use Cases
Domain WHOIS Checker supports many investigative and operational workflows.
Phishing Investigation
Check whether a suspicious domain is newly registered or has risky lifecycle signals.
Brand Protection
Monitor domains that imitate a company, product, or executive name.
Abuse Reporting
Find registrar and abuse contact information.
SOC Triage
Enrich suspicious domains from alerts, emails, logs, or SIEM events.
Domain Lifecycle Monitoring
Check expiration dates for owned or critical domains.
Infrastructure Review
Identify registrar, name servers, and DNSSEC status.
Threat Intelligence
Collect registration metadata for suspicious infrastructure.
Compliance and Documentation
Document domain ownership and registration details.
Fraud Analysis
Review domain age, registrar, and status flags for suspicious websites.
⚠️ Result Interpretation
WHOIS / RDAP data should be interpreted carefully.
Important points:
-
WHOIS data may be redacted for privacy.
-
Registrar data may differ from registry data.
-
Some fields may be missing or normalized.
-
Raw WHOIS formats vary by TLD and registrar.
-
Domain age does not prove legitimacy.
-
New domains are not automatically malicious.
-
Old domains are not automatically safe.
-
Status codes may reflect normal domain protection.
-
Expiration date may change after renewal.
-
DNSSEC unsigned does not automatically mean insecure or malicious.
-
Risk score is a heuristic, not a final verdict.
For legal, takedown, or high-impact security actions, validate with the registrar, registry, RDAP, DNS, certificate transparency, passive DNS, and content analysis.
✅ Recommended Analyst Workflow
A practical WHOIS investigation should follow these steps.
1. Enter a Clean Domain
Use only the domain name without protocol or path.
2. Enable Normalization Options
Use lower-case and trim to avoid input mistakes.
3. Enable Email Masking When Sharing
Mask email addresses before screenshots or external reports.
4. Review the Summary
Check activity status, risk, age, expiration, registrar, name server count, and detected emails.
5. Review Dates
Check creation, update, and expiration dates.
6. Review Registrar
Identify registrar, WHOIS server, and IANA ID.
7. Review Name Servers
Check whether name servers match expected infrastructure.
8. Review Status Codes
Look for transfer locks, holds, pending deletion, or lifecycle restrictions.
9. Inspect Raw WHOIS
Use raw WHOIS when parser output looks incomplete or unusual.
10. Use Parsed JSON
Use structured JSON for reports, automation, or case management.
🛡️ Security, Privacy & Responsible Use
Domain WHOIS Checker is intended for lawful domain intelligence, cybersecurity analysis, infrastructure review, and abuse reporting.
Acceptable use cases include:
-
Checking your own domains
-
Investigating suspicious domains
-
Reviewing phishing infrastructure
-
Finding registrar abuse contacts
-
Monitoring domain expiration
-
Supporting SOC triage
-
Brand protection
-
Threat intelligence enrichment
-
Compliance documentation
-
Infrastructure auditing
Users should follow responsible use principles:
-
Do not use contact information for harassment or spam.
-
Do not assume malicious intent from domain age alone.
-
Do not publish personal data from WHOIS records unnecessarily.
-
Respect privacy redaction and applicable data protection laws.
-
Validate important findings with additional sources.
-
Treat local history as sensitive on shared devices.
-
Use the tool only for lawful and ethical analysis.
⚙️ Technical Highlights
-
Domain WHOIS / RDAP checker
-
Available at
dash.niamonx.io/domain_whois -
Domain input
-
Lower-case option
-
Trim option
-
Email masking option
-
Client-side timing display
-
WHOIS / RDAP data normalization
-
Normalization of non-standard keys
-
Domain status detection
-
Risk score and risk level
-
Domain age calculation
-
Expiration remaining calculation
-
Registrar extraction
-
WHOIS server extraction
-
IANA registrar ID extraction
-
DNSSEC status
-
Creation date
-
Updated date
-
Expiration date
-
Name server extraction
-
Registry status extraction
-
Email extraction
-
Raw WHOIS viewer
-
Extra Text section
-
Parsed JSON section
-
Request history
-
Export support
-
Suitable for SOC, OSINT, phishing analysis, brand protection, compliance, and domain lifecycle monitoring
📌 Usage Hints
-
Enter only the domain name.
-
Do not include
https://, paths, query strings, or slashes. -
Use lower-case and trim for clean normalization.
-
Enable Mask email when sharing screenshots or reports.
-
Check domain age for phishing and fraud triage.
-
Check expiration for lifecycle risk.
-
Review registrar and WHOIS server for abuse escalation.
-
Review name servers for infrastructure context.
-
Review statuses to understand locks or lifecycle restrictions.
-
Use Raw WHOIS when parsed data looks incomplete.
-
Use Parsed JSON for technical workflows.
-
Remember that all data is provided “as is.”
-
Validate critical findings with additional sources.
📬 Contact Information
For technical, legal, abuse, privacy, or support-related inquiries, users can contact the NiamonX team directly:
support@niamonx.io — Technical Support
other@niamonx.io — General Inquiries
takedown@niamonx.io — Privacy or Data Removal Requests
legal@niamonx.io — Legal and Compliance Matters
Alternative contact channel:
🔗 Helpdesk: https://support.niamonx.io/
Summary
NiamonX Domain WHOIS Checker is a WHOIS / RDAP domain intelligence tool that normalizes raw registry responses and displays key domain registration metrics, including status, risk, age, expiration, registrar, WHOIS server, IANA ID, DNSSEC, name servers, statuses, emails, raw WHOIS, extra text, parsed JSON, and request history.
The tool is designed for phishing investigation, SOC triage, OSINT enrichment, brand protection, abuse reporting, domain lifecycle monitoring, compliance review, and infrastructure analysis. Results are provided “as is” and should be validated with official registrar, registry, DNS, and security sources when used for important decisions.
WebSite Screenshot | Web Capture & Device Emulation Tool
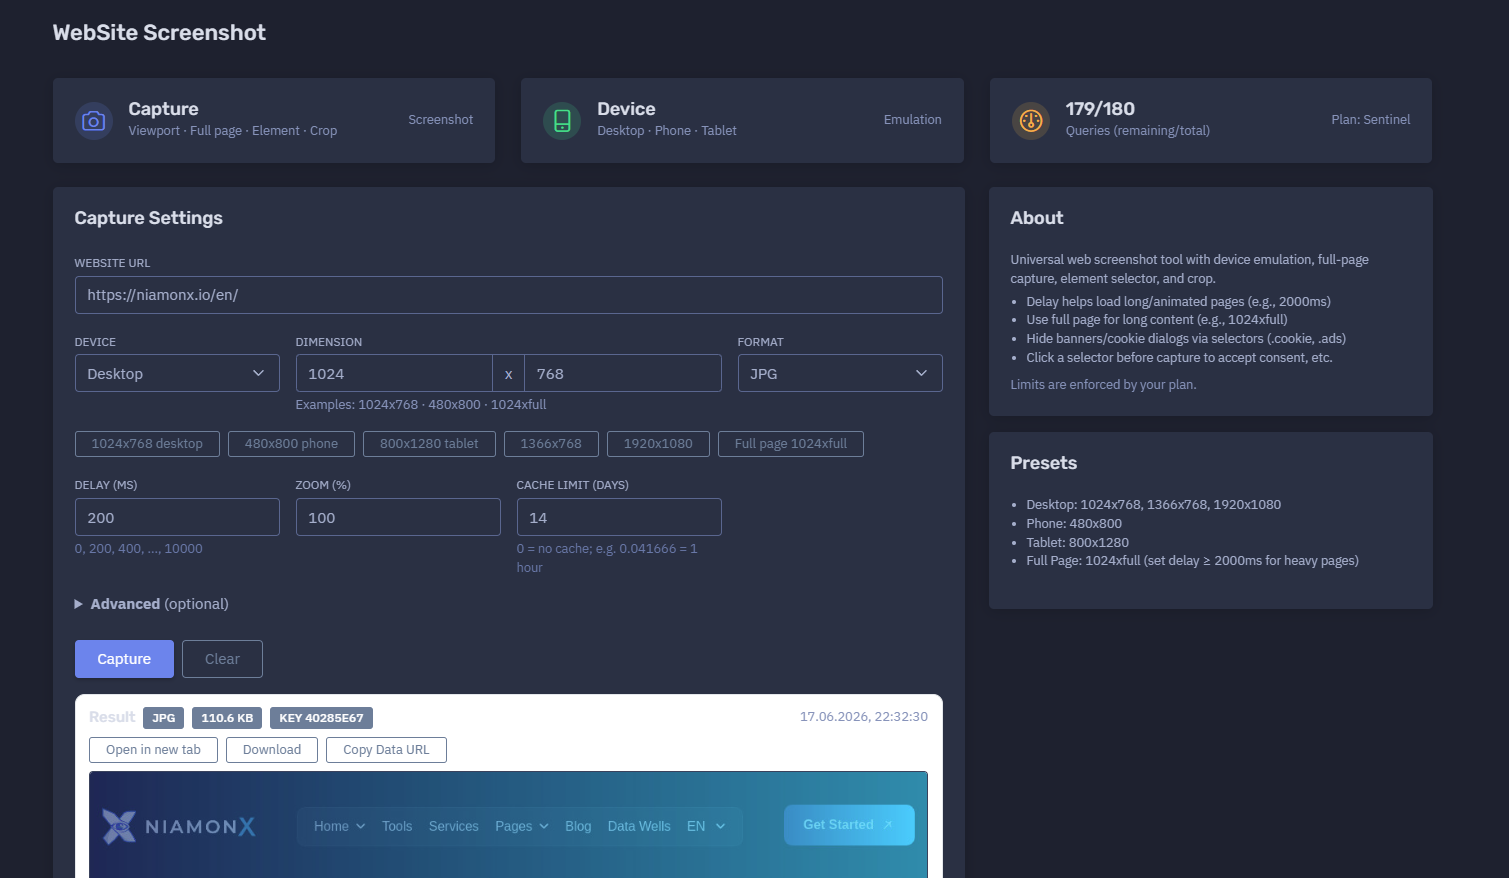
The platform available at https://dash.niamonx.io/webscreen — known as WebSite Screenshot — is a universal web screenshot and page-capture tool within the NiamonX platform. It allows users to capture visual snapshots of websites using desktop, phone, or tablet emulation, with support for viewport screenshots, full-page screenshots, DOM element capture, selector-based interaction, crop areas, custom headers, cookies, language settings, zoom, delay, cache control, and multiple output formats.
Overview of the Service
WebSite Screenshot is designed to help users capture accurate visual evidence of web pages, interfaces, landing pages, dashboards, public websites, suspicious pages, phishing pages, brand impersonation pages, documentation pages, and web content that needs to be reviewed, archived, or shared.
The tool can emulate different devices and screen sizes, wait for dynamic content to load, hide unwanted elements, click selectors before capture, crop a specific area, or capture the entire page. It is useful for OSINT analysts, SOC teams, brand protection teams, compliance departments, QA engineers, developers, investigators, content reviewers, and support teams.
The module supports several capture modes and configuration options, making it suitable for both quick screenshots and more controlled technical captures.
🔍 How the Tool Works
When a user enters a website URL and selects capture settings, WebSite Screenshot loads the page in a controlled rendering environment and creates a screenshot based on the selected options.
The tool can capture:
-
Standard viewport screenshots
-
Full-page screenshots
-
Mobile screenshots
-
Tablet screenshots
-
Desktop screenshots
-
Specific DOM elements
-
Cropped areas
-
Pages after clicking a selector
-
Pages after hiding selected elements
-
Pages with custom language, user-agent, or cookies
The result is returned as an image file with size, format, cache key, timestamp, and screenshot preview.
Example capture configuration:
Website URL: https://niamonx.io/en/
Device: Desktop
Dimension: 1024x768
Format: JPG
Delay: 200 ms
Zoom: 100%
Example result:
JPG
110.6 KB
Key: 40285e67
17.06.2026, 22:32:30
🧩 What Can Be Captured
WebSite Screenshot supports full website URLs.
Valid examples:
https://niamonx.io/en/
https://example.com/
https://docs.example.com/page
Unsupported or invalid examples:
example.com
niamonx.io/en/
localhost
file:///C:/page.html
For best results, users should enter a complete URL with http:// or https://.
⚙️ Capture Settings
The Capture Settings panel contains the main screenshot configuration options.
Website URL
The full URL of the page to capture.
Example:
https://niamonx.io/en/
The URL should include the protocol and should point to a page that can be loaded by the screenshot backend.
Device
The device setting controls browser emulation.
Available device modes may include:
-
Desktop
-
Phone
-
Tablet
Device emulation affects viewport size, user-agent behavior, layout rendering, and responsive design.
Example:
Device: Desktop
Dimension
The dimension field defines viewport width and height.
Example:
1024 x 768
Supported examples:
1024x768
480x800
1024xfull
The full height mode captures the full page instead of only the visible viewport.
Format
The output format controls the image type.
Example:
Format: JPG
Possible output formats may include:
-
JPG
-
PNG
-
WebP, depending on backend support
JPG is usually best for smaller file size. PNG is useful when sharper UI text, transparency, or lossless output is required.
Delay
Delay controls how long the tool waits before taking the screenshot.
Example:
Delay: 200 ms
Supported delay values may include:
0, 200, 400, ..., 10000
Delay is useful for pages that load content dynamically, show animations, fetch API data, display cookie banners, or need time for layout stabilization.
Recommended values:
| Page Type | Suggested Delay |
|---|---|
| Static page | 0–400 ms |
| Normal dynamic website | 1000–2000 ms |
| Heavy page / animations | 2000–5000 ms |
| Full-page capture | 2000 ms or more |
| Complex dashboards | 3000–10000 ms |
Zoom
Zoom controls the rendering scale.
Example:
Zoom: 100%
Zoom can be used when users need to capture a wider area, make text smaller or larger, or reproduce a specific visual layout.
Cache Limit
Cache limit controls how long a screenshot result may be reused.
Example:
Cache limit: 14 days
Special value:
0 = no cache
Example for one hour:
0.041666 = 1 hour
Caching improves speed and reduces repeated captures for the same URL and settings. When fresh visual evidence is required, cache should be disabled or reduced.
🖥️ Device Presets
The tool supports common device presets.
Desktop
Recommended sizes:
1024x768
1366x768
1920x1080
Desktop mode is useful for:
-
Standard website screenshots
-
Admin panels
-
Landing pages
-
Documentation pages
-
Full-width layouts
-
Web app interfaces
Phone
Recommended size:
480x800
Phone mode is useful for:
-
Mobile responsive testing
-
Mobile phishing page review
-
Mobile landing page capture
-
App-like web interface screenshots
-
Mobile UX documentation
Tablet
Recommended size:
800x1280
Tablet mode is useful for:
-
Tablet responsive testing
-
Mid-size layouts
-
Touch-oriented pages
-
Product QA workflows
Full Page
Example:
1024xfull
Full-page capture is useful for:
-
Long landing pages
-
Documentation pages
-
Terms and policy pages
-
Blog posts
-
Phishing kits
-
Evidence collection
-
Website archive snapshots
For heavy pages, a delay of at least 2000 ms is recommended.
🧠 Advanced Options
The Advanced section allows more precise control over the capture.
CSS Selector
The CSS Selector field captures a specific DOM element instead of the whole viewport.
Example:
#main-content
.article-body
Use cases:
-
Capture one component
-
Capture a login box
-
Capture a pricing table
-
Capture an article
-
Capture a modal
-
Capture a specific evidence block
Click Selector
The click selector is used to click an element before the screenshot is taken.
Examples:
.cookie-accept
#close
Use cases:
This option is useful for pages that require one simple interaction before capture.
Hide Selectors
Hide selectors remove or visually hide unwanted elements before capture.
Example:
.ads, .cookie, #modal
Use cases:
-
Hide advertisements
-
Hide cookie banners
-
Hide popups
-
Hide floating chat widgets
-
Hide overlays
-
Clean up screenshots for reports
Users should use this carefully when capturing evidence. If the screenshot is used for compliance, legal, or incident response, the report should mention that some elements were hidden.
Crop
The crop option captures a specific rectangle from the rendered page.
Format:
x,y,width,height
Example:
100,0,800,300
Use cases:
-
Capture header area
-
Capture only above-the-fold content
-
Capture one section of a page
-
Remove irrelevant page areas
-
Produce compact evidence images
Accept-Language
The Accept-Language field controls the language preference sent with the request.
Example:
en-US
This is useful when websites show different content based on language settings.
Examples:
en-US
de-DE
uk-UA
ru-RU
User-Agent
The User-Agent field allows custom browser identification.
Example:
Mozilla/5.0 (...)
Use cases:
-
Desktop browser emulation
-
Mobile browser emulation
-
Testing responsive behavior
-
Checking bot filtering behavior
-
Comparing content shown to different clients
Custom user-agent should be used responsibly and documented when screenshots are used as evidence.
Cookies
Format:
name1=value1;name2=value2
Use cases:
-
Capture authenticated-like states when authorized
-
Preserve consent state
-
Set language or region preferences
-
Reproduce a specific user session state
-
Capture pages that depend on cookie-based settings
📊 Result Section
After a successful capture, the result panel displays screenshot output details.
Typical fields include:
| Field | Description |
|---|---|
| Format | Output image format |
| File size | Size of generated screenshot |
| Key | Cache or result key |
| Timestamp | Capture time |
| Preview | Screenshot preview |
Example:
JPG
110.6 KB
Key 40285e67
17.06.2026, 22:32:30
The preview allows users to quickly verify that the capture looks correct before saving or using it in a report.
🕓 Local History
The tool stores recent capture requests locally in the user’s browser.
Example behavior:
Stores last 100 queries in your browser.
History entries may include:
-
Device mode
-
URL
-
Dimension
-
Output format
-
Capture timestamp
Example history item:
desktop
https://niamonx.io/en/
1024x768
JPG
17.06.2026, 22:32:30
Local history helps users repeat previous captures with the same settings.
Because history is stored locally, it may be cleared when users delete browser data, switch devices, or use a different browser profile.
🚦 Query Limits and Plan Access
WebSite Screenshot uses plan-based query limits.
Example:
179 / 180
Queries remaining / total
Plan: Sentinel
Important points:
-
Each capture request may consume plan quota.
-
Limits are enforced by the user’s plan.
-
Repeated captures with no cache may consume more requests.
-
Cached results may reduce repeated processing.
-
Large full-page captures may require more backend resources.
Users should monitor remaining queries when performing bulk captures or evidence collection.
🧠 Key Features
Universal Web Screenshot Capture
Captures public web pages and web interfaces into image format.
Device Emulation
Supports desktop, phone, and tablet modes.
Custom Viewport
Allows custom width and height values.
Full-Page Capture
Supports long-page screenshot capture using full height.
Element Capture
Captures a specific DOM element using a CSS selector.
Crop Capture
Captures a specific rectangle from the rendered page.
Delay Control
Waits before capture to allow dynamic content to load.
Zoom Control
Adjusts rendering scale.
Output Format Selection
Supports image output such as JPG and other configured formats.
Cookie and Header Control
Supports custom cookies, language headers, and user-agent.
Selector Interaction
Can click selectors before capture and hide selected elements.
Cache Control
Allows caching screenshot results for a configurable number of days.
Local History
Stores last 100 capture requests in the browser.
Plan-Based Limits
Access and query volume depend on the user’s plan.
🔎 Common Use Cases
WebSite Screenshot supports many practical workflows.
OSINT Evidence Capture
Capture public web pages for investigation notes.
Phishing Page Documentation
Capture suspicious login pages, clone pages, or malicious landing pages.
Brand Protection
Document impersonation pages, fake stores, fake login pages, or unauthorized brand use.
SOC and Incident Response
Attach visual evidence to security incidents and tickets.
Website QA
Test desktop, phone, and tablet rendering.
Compliance Review
Capture policy pages, consent banners, or public disclosures.
Content Monitoring
Create screenshots of public pages for review.
Support Documentation
Capture UI states for support tickets or user guides.
Archive Snapshots
Preserve visual appearance of pages at a specific time.
📸 Full-Page Capture
Full-page capture is useful when the content extends below the visible viewport.
Example:
1024xfull
Recommended settings for heavy pages:
Delay: 2000 ms or higher
Full-page screenshots are useful for:
-
Long product pages
-
Documentation
-
Blog posts
-
Terms pages
-
Phishing kits
-
Evidence reports
-
Landing pages
-
Marketing pages
Full-page captures may be larger and may take longer to process.
🧩 Element Capture
Element capture allows users to screenshot only a specific part of a page.
Example selector:
#pricing
This is useful when the user needs a clean image of one section without surrounding content.
Common selectors:
#main
.article
.login-form
.pricing-table
.hero
Element capture depends on valid CSS selectors and page structure. If the selector does not match any element, the capture may fail or return an empty result.
🧹 Cleaning the Page Before Capture
The tool can click and hide elements before capturing.
Click Selector
Use this to accept consent or close overlays.
Example:
.cookie-accept
Hide Selectors
Use this to remove visual clutter.
Example:
.ads, .cookie, #modal
Common elements to hide:
For evidence workflows, users should document any hidden or clicked elements so the screenshot remains transparent and reproducible.
🌍 Language, Region, and Session Context
Web pages may show different content depending on browser headers, cookies, region, and device.
WebSite Screenshot provides controls for:
-
Accept-Language
-
User-Agent
-
Cookies
-
Device mode
-
Viewport size
These settings help reproduce specific page states.
Examples:
Accept-Language: en-US
Device: Phone
Dimension: 480x800
Cookies: region=de;consent=yes
This is useful when investigating region-specific phishing pages, localized landing pages, or responsive layouts.
🧾 Cache Behavior
The cache limit controls how long the screenshot result can be reused.
Examples:
0 = no cache
14 = cache for 14 days
Cache is useful for:
-
Repeating the same capture
-
Reducing backend load
-
Faster access to previous results
-
Consistent screenshots for reports
No-cache mode is useful when:
-
The page changes frequently
-
Fresh evidence is required
-
Investigating live incidents
-
Verifying takedown status
-
Capturing time-sensitive content
⚠️ Result Interpretation
Screenshots should be interpreted carefully.
Important notes:
-
A screenshot captures only one point in time.
-
Dynamic pages may change after capture.
-
Ads, geolocation, cookies, and language can change page content.
-
Some pages detect automation or block rendering.
-
Delays may affect whether content appears.
-
Full-page screenshots can miss lazy-loaded content if it does not load properly.
-
Hidden selectors change the visible evidence.
-
Click selectors may alter the page state.
-
Cached screenshots may not show the latest page version.
-
A screenshot does not prove who controls the website.
For investigations, screenshots should be combined with timestamp, URL, DNS data, WHOIS, HTTP headers, TLS certificate data, and raw page evidence when available.
✅ Recommended Capture Workflow
A practical screenshot workflow should follow these steps.
1. Enter the Full URL
Use https:// or http:// and include the exact path.
2. Choose Device Mode
Select desktop, phone, or tablet depending on the page version you need.
3. Set Dimensions
Use a standard viewport such as 1024x768, 480x800, or 1024xfull.
4. Choose Format
Use JPG for small files or PNG when sharper UI quality is needed.
5. Set Delay
Use at least 2000 ms for heavy or dynamic pages.
6. Handle Popups
Use click selector or hide selectors for cookie banners, ads, or modals when appropriate.
7. Use Full Page or Crop
Use full page for long content or crop for a precise section.
8. Set Language and Cookies if Needed
Use Accept-Language, User-Agent, or Cookies to reproduce a specific state.
9. Review Preview
Confirm that the screenshot captured the correct content.
10. Save Evidence Securely
Store screenshots and settings together when used for investigations or reports.
🛡️ Security, Privacy & Responsible Use
WebSite Screenshot is intended for lawful web capture, documentation, OSINT, QA, compliance, support, and cybersecurity workflows.
Acceptable use cases include:
-
Capturing your own websites
-
Capturing public pages for documentation
-
Phishing page evidence collection
-
Brand abuse documentation
-
QA and responsive testing
-
Compliance screenshots
-
Support and bug reports
-
SOC and incident response evidence
-
Public OSINT investigation
Users should follow responsible use principles:
-
Do not capture private pages without authorization.
-
Do not submit sensitive session cookies unless authorized.
-
Do not use screenshots for harassment, doxxing, or impersonation.
-
Do not bypass access controls.
-
Do not misuse user-agent or cookies to access restricted content.
-
Document advanced settings when screenshots are used as evidence.
-
Treat screenshot history as sensitive on shared devices.
-
Validate critical findings with additional technical evidence.
⚙️ Technical Highlights
-
Universal web screenshot tool
-
Available at
dash.niamonx.io/webscreen -
Supports website URL capture
-
Desktop, phone, and tablet emulation
-
Custom viewport dimensions
-
Full-page capture with
fullheight -
JPG output support
-
Delay control from 0 to 10000 ms
-
Zoom percentage control
-
Cache limit in days
-
CSS selector element capture
-
Click selector before capture
-
Hide selectors before capture
-
Crop region support
-
Accept-Language override
-
Custom User-Agent support
-
Cookie injection support
-
Screenshot preview
-
Result key and timestamp
-
Local browser history
-
Stores last 100 queries locally
-
Plan-based query limits
-
Suitable for OSINT, SOC, QA, compliance, documentation, and support workflows
📌 Usage Hints
-
Use full URLs with
https://orhttp://. -
Use
1024x768for standard desktop screenshots. -
Use
480x800for phone screenshots. -
Use
800x1280for tablet screenshots. -
Use
1024xfullfor long pages. -
Set delay to at least 2000 ms for heavy full-page captures.
-
Use
.cookie,.ads, or#modalin hide selectors to clean screenshots. -
Use click selector to accept consent or close overlays.
-
Use crop when only one area is needed.
-
Use cache
0when fresh evidence is required. -
Be careful with cookies and session data.
-
Remember that limits are enforced by your plan.
-
Local history stores the last 100 capture requests in the browser.
📬 Contact Information
For technical, legal, abuse, privacy, or support-related inquiries, users can contact the NiamonX team directly:
support@niamonx.io — Technical Support
other@niamonx.io — General Inquiries
takedown@niamonx.io — Privacy or Data Removal Requests
legal@niamonx.io — Legal and Compliance Matters
Alternative contact channel:
🔗 Helpdesk: https://support.niamonx.io/
Summary
NiamonX WebSite Screenshot is a flexible screenshot capture and device emulation tool for public web pages. It supports desktop, phone, and tablet rendering, custom viewport dimensions, full-page capture, element capture, crop regions, delay, zoom, cache control, selector-based clicking, selector hiding, custom language, user-agent, cookies, screenshot preview, local history, and plan-based query limits.
The tool is designed for OSINT evidence collection, phishing investigation, SOC workflows, brand protection, QA testing, compliance documentation, support cases, and web archive snapshots. Screenshots should be treated as point-in-time visual evidence and interpreted together with the capture settings, timestamp, URL, and supporting technical data.
Website to PDF | Webpage PDF Conversion Tool
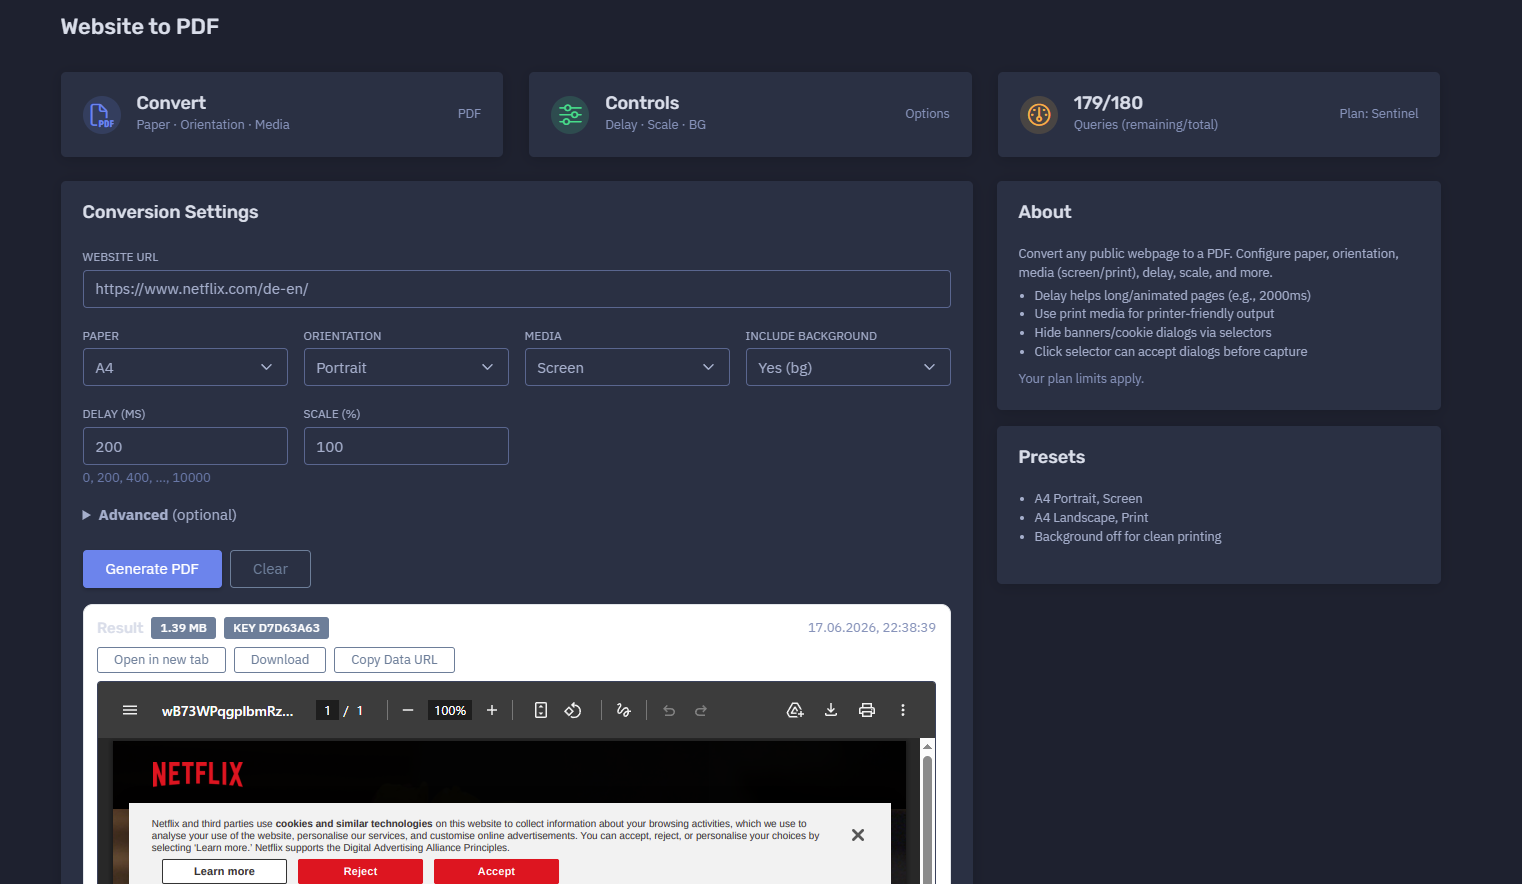
The platform available at https://dash.niamonx.io/web_topdf — known as Website to PDF — is a webpage-to-PDF conversion tool within the NiamonX platform. It allows users to convert public webpages into PDF documents with configurable paper size, orientation, rendering media mode, delay, scale, background rendering, cookies, language headers, custom user-agent, click selectors, and hidden elements.
Overview of the Service
Website to PDF is designed to help users convert public web pages into structured PDF files for documentation, investigation, evidence preservation, compliance review, QA testing, reporting, archiving, and sharing.
The tool loads a target webpage in a controlled rendering environment and exports it as a PDF document based on the selected conversion settings. Users can choose paper layout, orientation, screen or print rendering mode, background rendering, delay, scale, and several advanced options that help reproduce a specific page state.
Website to PDF is useful for OSINT analysts, SOC teams, cybersecurity investigators, compliance departments, brand protection teams, support teams, legal reviewers, QA engineers, developers, researchers, and documentation teams.
The module is especially helpful when users need a portable, timestamped, shareable PDF representation of a website instead of a screenshot image.
🔍 How the Tool Works
When a user enters a website URL and selects conversion settings, Website to PDF loads the page, waits according to the configured delay, optionally performs selector-based actions, applies rendering options, and generates a PDF file.
The tool can convert:
-
Public webpages
-
Landing pages
-
Documentation pages
-
Articles and blog posts
-
Product pages
-
Policy pages
-
Terms and privacy pages
-
Public dashboards
-
Printer-friendly pages
-
Suspicious or phishing pages
-
Brand impersonation pages
-
Pages that require simple cookie/banner handling
Example conversion configuration:
Website URL: https://www.netflix.com/de-en/
Paper: A4
Orientation: Portrait
Media: Screen
Include background: Yes
Delay: 200 ms
Scale: 100%
Example result:
PDF
1.39 MB
Key: d7d63a63
17.06.2026, 22:38:39
🧩 What Can Be Converted
Website to PDF supports complete public website URLs.
Valid examples:
https://www.netflix.com/de-en/
https://niamonx.io/
https://help.ubuntu.ru/wiki/nginx-phpfpm
https://www.netacad.com
Unsupported or invalid examples:
netflix.com
www.netflix.com/de-en/
localhost
file:///C:/page.html
192.168.1.1
For best results, users should enter a complete URL with http:// or https://.
Private, local, internal, or restricted resources may not be accessible from the conversion backend unless they are publicly reachable and authorized for capture.
⚙️ Conversion Settings
The Conversion Settings panel contains the main PDF generation options.
Website URL
The full URL of the page to convert into PDF.
Example:
https://www.netflix.com/de-en/
The URL should include the protocol and should point to a webpage that can be loaded by the backend.
Recommended format:
https://domain.com/path
The entered page should be publicly accessible or intentionally accessible through the provided authorized context, such as cookies.
Paper
The paper setting controls the target PDF page size.
Example:
Paper: A4
A4 is commonly used for reports, evidence exports, documentation, compliance archives, and printable records.
Common use cases for A4:
-
Investigation reports
-
Evidence bundles
-
Compliance documentation
-
Policy page exports
-
Legal review material
-
Support attachments
-
Printable documentation
Depending on backend configuration, additional paper sizes may be supported. The current interface example uses A4.
Orientation
Orientation controls whether the PDF page is generated vertically or horizontally.
Available orientation modes include:
-
Portrait
-
Landscape
Example:
Orientation: Portrait
Portrait mode is usually best for articles, policy pages, documentation pages, legal pages, and standard website exports.
Landscape mode is useful for wide layouts, dashboards, tables, admin panels, pricing comparisons, or pages with horizontal UI elements.
Example:
Orientation: Landscape
Recommended orientation:
| Page Type | Suggested Orientation |
|---|---|
| Article or blog post | Portrait |
| Terms or privacy policy | Portrait |
| Documentation page | Portrait |
| Wide dashboard | Landscape |
| Pricing table | Landscape |
| Data table | Landscape |
| Landing page | Portrait or Landscape |
Media
The media setting controls how the webpage is rendered before PDF generation.
Available media modes include:
-
Screen
-
Print
Example:
Media: Screen
Screen mode captures the page as it would normally appear in a browser.
Print mode uses the website’s print stylesheet when available. This can produce cleaner, more document-like output for pages that support printer-friendly layouts.
Example:
Media: Print
Recommended media mode:
| Goal | Suggested Media |
|---|---|
| Preserve visual browser appearance | Screen |
| Create printer-friendly PDF | |
| Capture marketing landing page | Screen |
| Export documentation | Print or Screen |
| Export policy or legal page | |
| Capture phishing or scam page | Screen |
| Remove unnecessary web UI naturally |
Important note: Print mode may change the appearance of the page because many websites hide navigation menus, banners, sidebars, videos, ads, and interactive elements in their print stylesheet.
Include Background
The Include Background option controls whether backgrounds are rendered in the PDF.
Example:
Include background: Yes
When enabled, the PDF includes background colors, background images, section backgrounds, hero blocks, styled buttons, and other visual design elements.
When disabled, the PDF may look cleaner and more printer-friendly.
Example:
Include background: No
Recommended usage:
| Goal | Include Background |
|---|---|
| Visual evidence | Yes |
| Brand impersonation documentation | Yes |
| Phishing page capture | Yes |
| Clean printing | No |
| Text-focused review | No |
| Smaller PDF size | No |
| UI/UX documentation | Yes |
For evidence workflows, background rendering should usually stay enabled because it preserves the page’s visual appearance more accurately.
Delay
Delay controls how long the tool waits before generating the PDF.
Example:
Delay: 200 ms
Supported delay values may include:
0, 200, 400, ..., 10000
Delay is useful when pages need time to load dynamic content, animations, external resources, cookie banners, fonts, images, API data, or lazy-loaded sections.
Recommended delay values:
| Page Type | Suggested Delay |
|---|---|
| Simple static page | 0–400 ms |
| Normal website | 1000–2000 ms |
| Dynamic landing page | 2000–3000 ms |
| Heavy page with animations | 3000–5000 ms |
| Complex dashboard | 3000–10000 ms |
| Page with cookie banner | 1000–3000 ms |
| Page with lazy-loaded content | 2000–5000 ms |
| Evidence capture | 2000 ms or more |
Example for a heavier page:
Delay: 2000 ms
A longer delay can improve completeness, but it may also increase processing time and resource usage.
Scale
Scale controls the rendering size of the webpage content inside the PDF.
Example:
Scale: 100%
Scale can be used to fit more content on each page or make content larger and easier to read.
Examples:
Scale: 80%
Scale: 100%
Scale: 120%
Recommended usage:
| Goal | Suggested Scale |
|---|---|
| Default PDF export | 100% |
| Fit more content per page | 70–90% |
| Improve readability | 110–125% |
| Capture wide layout on A4 | 70–90% |
| Preserve normal browser feel | 100% |
Scale affects layout, pagination, text size, and the number of PDF pages.
🧠 Advanced Options
The Advanced section allows more controlled webpage conversion.
Click Selector
The Click Selector option clicks a specific element before PDF generation.
Example:
.cookie-accept
#close
Use cases:
Example:
Click selector: .cookie-accept
This option is useful when a page blocks content with a banner or modal that can be handled with one simple click.
For evidence workflows, users should document the clicked selector because it changes the visible state of the page.
Hide Selectors
Hide Selectors allows users to hide unwanted elements before converting the page to PDF.
Example:
.ads, .cookie, #modal
Use cases:
-
Hide advertisements
-
Hide cookie banners
-
Hide newsletter popups
-
Hide floating chat widgets
-
Hide sticky headers
-
Hide overlays
-
Remove irrelevant UI elements
-
Create cleaner documentation PDFs
Common selectors:
.ads
.cookie
#modal
.newsletter
.chat-widget
.sticky-header
Example:
Hide selectors: .ads, .cookie, #modal
Users should use this option carefully when creating evidence. If elements were hidden, the report should mention it so the PDF remains transparent and reproducible.
Cookies
Format:
name1=value1;name2=value2
Example:
region=de;consent=yes
Use cases:
-
Preserve consent state
-
Set language or region preferences
-
Reproduce a specific page state
-
Capture pages that depend on cookie-based settings
-
Avoid repeated cookie banners
-
Capture authorized content when the user has permission
Important security note: Users should not paste sensitive session cookies unless they are authorized and fully understand the risk. Session cookies can provide access to accounts or private data.
For sensitive investigations, cookies should be handled as confidential data.
Accept-Language
Accept-Language controls the language preference sent with the webpage request.
Example:
Accept-Language: en-US
Other examples:
de-DE
uk-UA
ru-RU
This is useful when websites show different content depending on language settings.
Use cases:
-
Capture localized landing pages
-
Compare regional content
-
Investigate language-specific phishing pages
-
Export documentation in a specific language
-
Reproduce content shown to users from a certain locale
Example:
Accept-Language: de-DE
User-Agent
The User-Agent field allows custom browser identification during conversion.
Example:
Mozilla/5.0 (...)
Use cases:
-
Desktop browser emulation
-
Mobile browser behavior testing
-
Checking content variation by browser
-
Reproducing a specific client environment
-
Comparing bot-filtered or browser-specific content
-
Debugging rendering differences
Custom user-agent should be used responsibly and documented when the PDF is used as evidence.
📄 Result Section
After a successful conversion, the Result panel displays PDF output details.
Typical fields include:
| Field | Description |
|---|---|
| File size | Size of the generated PDF |
| Key | Cache or result identifier |
| Timestamp | Date and time of PDF generation |
| Output | Generated PDF document |
Example:
1.39 MB
Key d7d63a63
17.06.2026, 22:38:39
The result allows users to confirm that the conversion was completed and that the generated PDF is available for review, download, sharing, or reporting.
PDF file size depends on:
-
Page length
-
Images
-
Fonts
-
Backgrounds
-
Media mode
-
Scale
-
Paper size
-
Number of generated pages
-
Dynamic content
-
Website complexity
🕓 Local History
Website to PDF stores recent conversion requests locally in the user’s browser.
Example behavior:
Stores last 100 queries in your browser.
History entries may include:
-
Website URL
-
Paper size
-
Orientation
-
Media mode
-
Conversion timestamp
Example history item:
https://www.netflix.com/de-en/
A4
PORTRAIT
SCREEN
17.06.2026, 22:38:39
Another example:
https://www.netacad.com
A4
PORTRAIT
PRINT
12.10.2025, 23:12:38
Local history helps users repeat previous conversions with the same or similar settings.
Because history is stored locally, it may be cleared when users delete browser data, change browsers, use a different device, or switch browser profiles.
🚦 Query Limits and Plan Access
Website to PDF uses plan-based query limits.
Example:
179 / 180
Queries remaining / total
Plan: Sentinel
Important points:
-
Each conversion request may consume plan quota.
-
Limits depend on the active user plan.
-
Repeated conversions may consume additional queries.
-
Heavy pages may require more backend resources.
-
Long delays and complex pages may increase processing cost.
-
Failed conversions may still count depending on backend rules.
-
Plan limits apply to normal and advanced usage.
Users should monitor remaining queries when converting multiple pages for reports, investigations, evidence packages, compliance reviews, or bulk documentation.
🧠 Key Features
Webpage to PDF Conversion
Converts public webpages into portable PDF documents.
Paper Configuration
Supports paper-based PDF output such as A4.
Orientation Control
Allows Portrait or Landscape PDF layout.
Media Rendering
Supports Screen and Print media rendering modes.
Background Rendering
Can include or exclude webpage backgrounds.
Delay Control
Waits before conversion to allow dynamic content to load.
Scale Control
Adjusts webpage rendering size inside the PDF.
Selector Interaction
Can click a selected element before conversion.
Hide Selectors
Can hide unwanted page elements before PDF generation.
Cookie Support
Language Header Control
Supports Accept-Language customization.
User-Agent Control
Allows custom browser identification.
Result Metadata
Displays PDF size, result key, and timestamp.
Local History
Stores the last 100 conversion requests in the browser.
Plan-Based Limits
Access and query volume depend on the user’s plan.
🔎 Common Use Cases
Website to PDF supports many practical workflows.
OSINT Evidence Export
Convert public webpages into PDF documents for investigation notes and reports.
Phishing Page Documentation
Export suspicious login pages, clone pages, scam pages, or malicious landing pages as PDF evidence.
Brand Protection
Document fake websites, impersonation pages, counterfeit stores, unauthorized brand use, or misleading public pages.
SOC and Incident Response
Attach PDF evidence to incident tickets, case management systems, internal reports, or escalation workflows.
Compliance Review
Export terms, privacy policies, cookie notices, public disclosures, regulatory pages, or public-facing statements.
Legal and Audit Documentation
Create PDF records of public webpages for legal review, audit trails, or compliance archives.
QA and Web Testing
Check how pages render in screen or print mode and preserve output for bug reports.
Documentation Archiving
Convert technical documentation, help pages, guides, or knowledge base pages into PDF files.
Support Cases
Attach converted web pages to support tickets for easier review.
Research and Reporting
Save public articles, pages, and references as stable PDF documents for later analysis.
Printer-Friendly Output
Use print media and background control to create clean, readable PDF files.
📐 Paper, Orientation, and Media Recommendations
The best settings depend on the target page and intended use.
Standard Webpage Export
Recommended settings:
Paper: A4
Orientation: Portrait
Media: Screen
Include background: Yes
Delay: 1000–2000 ms
Scale: 100%
Best for:
-
Landing pages
-
Public websites
-
Visual evidence
-
Brand protection
-
Phishing pages
-
General webpage archiving
Clean Printable PDF
Recommended settings:
Paper: A4
Orientation: Portrait
Media: Print
Include background: No
Delay: 1000–2000 ms
Scale: 100%
Best for:
-
Articles
-
Policies
-
Terms pages
-
Documentation
-
Legal review
-
Text-focused reports
Wide Layout or Table Export
Recommended settings:
Paper: A4
Orientation: Landscape
Media: Screen
Include background: Yes
Delay: 2000 ms
Scale: 80–90%
Best for:
-
Dashboards
-
Pricing tables
-
Comparison pages
-
Wide UI layouts
-
Data tables
-
Admin panels
Heavy Dynamic Page
Recommended settings:
Paper: A4
Orientation: Portrait
Media: Screen
Include background: Yes
Delay: 3000–5000 ms
Scale: 100%
Best for:
-
JavaScript-heavy websites
-
Animated pages
-
Pages with lazy-loaded content
-
Pages with delayed API data
-
Complex landing pages
Evidence Collection
Recommended settings:
Paper: A4
Orientation: Portrait
Media: Screen
Include background: Yes
Delay: 2000 ms or higher
Scale: 100%
Recommended evidence notes:
URL
Timestamp
Paper size
Orientation
Media mode
Delay
Scale
Background setting
Click selector
Hide selectors
Cookies used
Accept-Language
User-Agent
Result key
For investigation work, PDF output should be stored together with conversion settings and supporting technical evidence.
🖨️ Screen Media vs Print Media
Website to PDF supports two major rendering modes: Screen and Print.
Screen Media
Screen media renders the webpage as it appears in a normal browser.
Best for:
-
Visual evidence
-
Phishing pages
-
Brand impersonation
-
Landing pages
-
Public web UI
-
Screenshot-like PDF exports
-
Design and QA review
Example:
Media: Screen
Screen mode is usually the best choice when visual appearance matters.
Print Media
Print media uses the website’s print stylesheet if available.
Best for:
-
Clean PDFs
-
Documentation
-
Articles
-
Policies
-
Terms pages
-
Legal review
-
Printer-friendly output
Example:
Media: Print
Print mode may remove or change:
Print mode can produce cleaner output, but it may not reflect what a normal user saw in the browser.
🧹 Cleaning the Page Before Conversion
Some websites display banners, overlays, popups, ads, or chat widgets that interfere with PDF output.
Website to PDF provides two main cleanup options:
Click Selector
Use Click Selector when an element needs to be clicked before conversion.
Example:
.cookie-accept
Common uses:
Hide Selectors
Use Hide Selectors when elements should be visually removed before conversion.
Example:
.ads, .cookie, #modal
Common elements to hide:
For evidence and compliance workflows, users should document all cleanup actions.
Example documentation note:
Before PDF generation, the selector .cookie-accept was clicked and .ads, #modal were hidden.
🌍 Language, Region, and Session Context
Webpages may show different content depending on language, region, cookies, browser type, or session context.
Website to PDF provides controls for:
Examples:
Accept-Language: en-US
Accept-Language: de-DE
Cookies: region=de;consent=yes
User-Agent: Mozilla/5.0 (...)
These settings help reproduce a more specific page state.
Use cases:
-
Region-specific content review
-
Localized phishing page investigation
-
Language-specific landing page capture
-
Cookie-consent state preservation
-
Browser-specific rendering comparison
-
Reproducing a user-reported issue
Important note: A PDF created with custom cookies, language, or user-agent reflects that specific request context, not necessarily the default version of the website.
📊 Result Interpretation
PDF output should be interpreted carefully.
Important notes:
-
A PDF captures a webpage at one point in time.
-
Dynamic content may change after conversion.
-
Screen and print media can produce different results.
-
Cookies can change what content is shown.
-
Accept-Language can change language and regional content.
-
User-Agent can affect layout and content.
-
Hidden selectors change the visible output.
-
Click selectors may change the page state.
-
Background disabled may remove important visual elements.
-
Scale can affect pagination and layout.
-
Some websites block automated rendering.
-
Some resources may fail to load.
-
Lazy-loaded content may be incomplete without enough delay.
-
A PDF does not prove who owns or controls a website.
For investigations, PDF evidence should be combined with:
-
Exact URL
-
Timestamp
-
HTTP headers
-
DNS records
-
WHOIS data
-
TLS certificate details
-
Screenshot evidence
-
HTML source when available
-
Redirect chain
-
IP information
-
Threat intelligence context
-
Analyst notes
✅ Recommended Conversion Workflow
A practical Website to PDF workflow should follow these steps.
1. Enter the Full Website URL
Use a complete URL with protocol.
Example:
https://www.netflix.com/de-en/
Avoid incomplete URLs such as:
www.netflix.com/de-en/
2. Select Paper Size
Use A4 for standard reports, documentation, and printable PDF output.
Example:
Paper: A4
3. Choose Orientation
Use Portrait for normal pages and Landscape for wide layouts.
Example:
Orientation: Portrait
4. Choose Media Mode
Use Screen for visual accuracy and Print for printer-friendly output.
Example:
Media: Screen
5. Decide Whether to Include Background
Use background enabled for visual evidence.
Example:
Include background: Yes
Use background disabled for clean printing.
Example:
Include background: No
6. Set Delay
Use a short delay for simple pages and a longer delay for dynamic pages.
Example:
Delay: 2000 ms
7. Set Scale
Start with 100%. Reduce scale if content is too large or too wide.
Example:
Scale: 100%
8. Handle Popups or Cookie Banners
Use Click Selector or Hide Selectors when needed.
Example:
Click selector: .cookie-accept
Example:
Hide selectors: .ads, .cookie, #modal
9. Add Language, User-Agent, or Cookies if Needed
Use advanced settings to reproduce a specific context.
Example:
Accept-Language: de-DE
Cookies: region=de;consent=yes
10. Generate and Review the PDF
Check the result size, key, timestamp, and output.
Example:
1.39 MB
Key d7d63a63
17.06.2026, 22:38:39
11. Store the PDF With Context
For professional workflows, store the PDF together with the conversion settings.
Recommended record:
URL: https://www.netflix.com/de-en/
Paper: A4
Orientation: Portrait
Media: Screen
Include background: Yes
Delay: 200 ms
Scale: 100%
Result key: d7d63a63
Timestamp: 17.06.2026, 22:38:39
🛡️ Security, Privacy & Responsible Use
Website to PDF is intended for lawful webpage conversion, documentation, OSINT, QA, compliance, support, cybersecurity, and evidence workflows.
Acceptable use cases include:
-
Converting your own websites
-
Exporting public pages for documentation
-
Capturing public evidence
-
Documenting phishing pages
-
Reviewing brand abuse
-
Archiving public policy pages
-
Creating support attachments
-
Testing print rendering
-
Generating compliance records
-
Saving public documentation as PDF
Users should follow responsible use principles:
-
Do not convert private pages without authorization.
-
Do not submit sensitive session cookies unless authorized.
-
Do not use the tool to bypass access controls.
-
Do not misuse user-agent or cookies to access restricted content.
-
Do not use generated PDFs for harassment, doxxing, impersonation, or abuse.
-
Document advanced settings when PDFs are used as evidence.
-
Treat local history as sensitive on shared devices.
-
Store PDFs securely when they contain investigative or confidential context.
-
Validate critical findings with additional technical evidence.
⚙️ Technical Highlights
-
Webpage to PDF conversion tool
-
Available at
dash.niamonx.io/web_topdf -
Converts public webpages into PDF documents
-
Supports A4 paper output
-
Supports Portrait and Landscape orientation
-
Supports Screen and Print media modes
-
Supports background rendering control
-
Delay control from 0 to 10000 ms
-
Scale percentage control
-
Click selector before conversion
-
Hide selectors before conversion
-
Cookie injection support
-
Accept-Language override
-
Custom User-Agent support
-
Result file size display
-
Result key generation
-
Timestamped output
-
Local browser history
-
Stores last 100 queries locally
-
Plan-based query limits
-
Suitable for OSINT, SOC, QA, compliance, documentation, support, legal review, and cybersecurity workflows
📌 Usage Hints
-
Use full URLs with
https://orhttp://. -
Use A4 Portrait Screen for standard webpage exports.
-
Use A4 Landscape for wide pages, dashboards, and tables.
-
Use Print media for cleaner printer-friendly documents.
-
Use Screen media when visual evidence matters.
-
Keep background enabled for phishing, brand abuse, and visual evidence.
-
Disable background for cleaner printing and smaller PDFs.
-
Use at least 2000 ms delay for dynamic pages.
-
Use longer delay for animated, lazy-loaded, or heavy pages.
-
Use scale 100% as the default.
-
Reduce scale to 80–90% for wide layouts.
-
Use Click Selector to accept cookie banners or close dialogs.
-
Use Hide Selectors to remove ads, banners, popups, or overlays.
-
Use Accept-Language to capture localized page versions.
-
Use Cookies only when authorized and necessary.
-
Use custom User-Agent responsibly.
-
Review generated PDFs before using them in reports.
-
Store conversion settings together with the PDF for reproducibility.
-
Remember that plan limits apply.
-
Local history stores the last 100 conversion requests in the browser.
🧾 Example Configurations
Basic PDF Export
Website URL: https://niamonx.io
Paper: A4
Orientation: Portrait
Media: Screen
Include background: Yes
Delay: 200 ms
Scale: 100%
Best for normal visual webpage export.
Printer-Friendly Export
Website URL: https://www.netacad.com
Paper: A4
Orientation: Portrait
Media: Print
Include background: No
Delay: 1000 ms
Scale: 100%
Best for clean reading and printing.
Investigation Evidence Export
Website URL: https://www.netflix.com/de-en/
Paper: A4
Orientation: Portrait
Media: Screen
Include background: Yes
Delay: 2000 ms
Scale: 100%
Click selector: .cookie-accept
Hide selectors: .ads, #modal
Accept-Language: de-DE
Best for documenting a specific visual page state.
Wide Page Export
Website URL: https://example.com/dashboard
Paper: A4
Orientation: Landscape
Media: Screen
Include background: Yes
Delay: 2000 ms
Scale: 80%
Best for dashboards, tables, and wide layouts.
📬 Contact Information
For technical, legal, abuse, privacy, or support-related inquiries, users can contact the NiamonX team directly:
support@niamonx.io — Technical Support
other@niamonx.io — General Inquiries
takedown@niamonx.io — Privacy or Data Removal Requests
legal@niamonx.io — Legal and Compliance Matters
Alternative contact channel:
🔗 Helpdesk: https://support.niamonx.io/
Summary
NiamonX Website to PDF is a flexible webpage PDF conversion tool for public websites. It supports paper configuration, Portrait and Landscape orientation, Screen and Print rendering modes, background control, delay, scale, selector-based clicking, selector hiding, cookies, Accept-Language, custom User-Agent, result metadata, local history, and plan-based limits.
The tool is designed for OSINT evidence export, phishing investigation, SOC workflows, brand protection, QA testing, compliance documentation, support cases, legal review, research, and web archiving. Generated PDFs should be treated as point-in-time webpage records and interpreted together with the exact URL, timestamp, conversion settings, result key, and supporting technical evidence.
IP WHOIS | RDAP / WHOIS IP Intelligence Tool
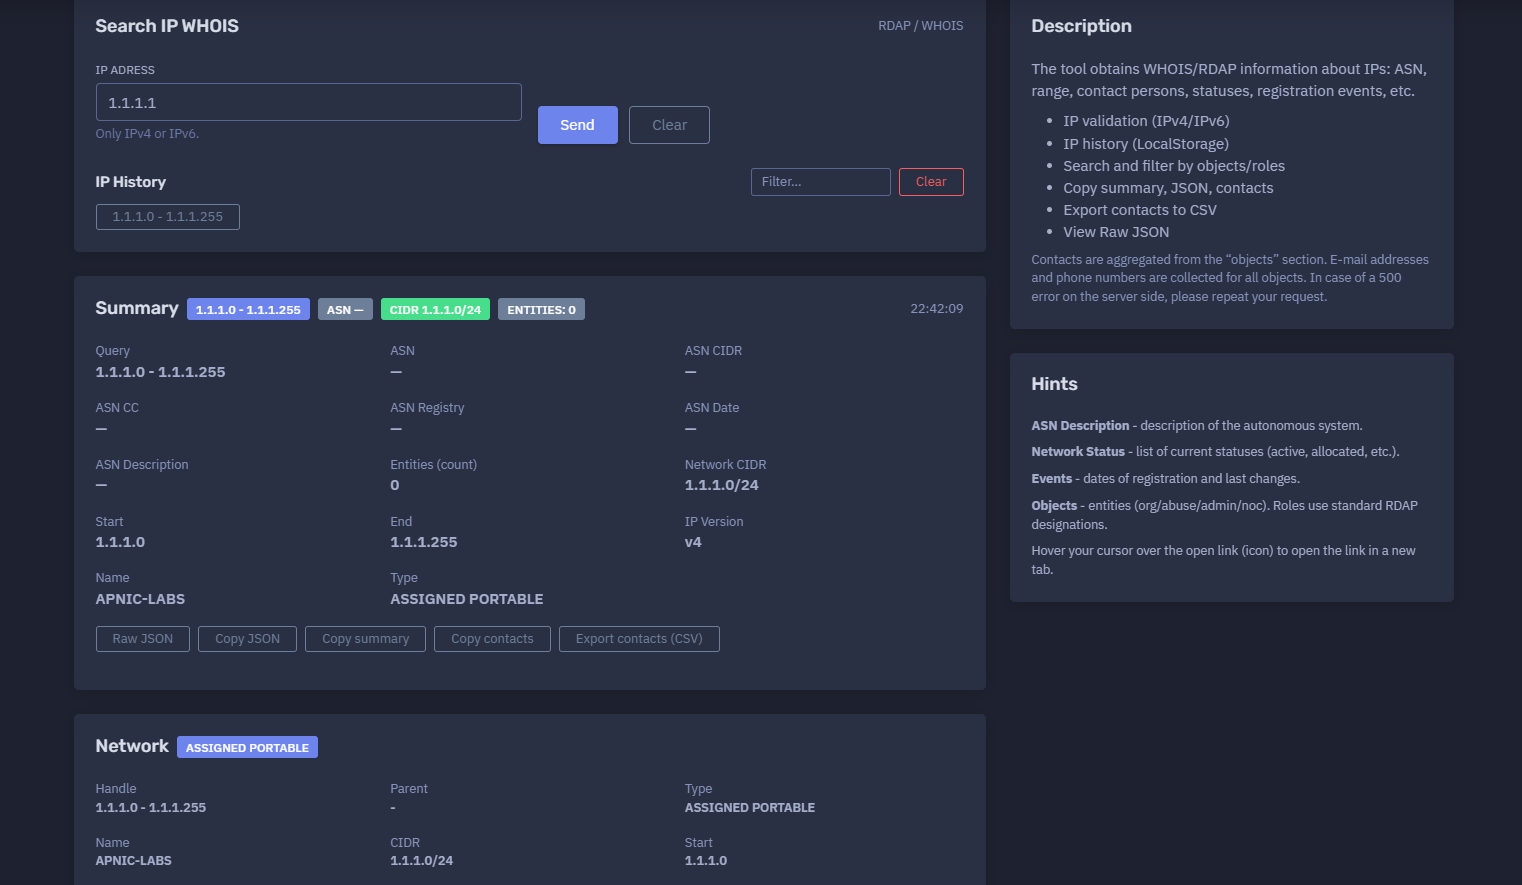
The platform available at https://dash.niamonx.io/ip_whois — known as IP WHOIS — is an IP intelligence and registration lookup tool within the NiamonX platform. It allows users to search RDAP / WHOIS information for IPv4 and IPv6 addresses, including network ranges, CIDR blocks, IP version, country, network name, allocation type, registration status, events, notices, remarks, related entities, contacts, abuse contacts, administrative contacts, technical contacts, RDAP links, and raw JSON data.
Overview of the Service
IP WHOIS is designed to help users investigate the public registration and network ownership information associated with an IP address. The tool retrieves structured RDAP / WHOIS data and presents it in an analyst-friendly interface.
It is useful for cybersecurity investigations, OSINT research, incident response, SOC triage, abuse reporting, infrastructure mapping, network ownership checks, threat intelligence enrichment, compliance review, and technical due diligence.
Instead of manually querying multiple WHOIS or RDAP endpoints, users can enter a single IP address and receive a structured summary of the network, related objects, contacts, events, statuses, and remarks.
The tool is especially helpful when users need to answer questions such as:
-
Which network range contains this IP address?
-
What CIDR block is associated with the IP?
-
Which organization or registry is linked to the network?
-
Is there an abuse contact for reporting malicious activity?
-
What administrative or technical contacts are listed?
-
What country is associated with the registration data?
-
What RDAP links are available for verification?
-
What registration events or update events exist?
-
What raw JSON data was returned by the source?
-
Which contacts can be exported for reporting or escalation?
🔍 How the Tool Works
When a user enters an IPv4 or IPv6 address, IP WHOIS validates the input and performs an RDAP / WHOIS lookup. The result is parsed and displayed in multiple structured sections.
Example query:
IP Address: 1.1.1.1
Example result summary:
Range: 1.1.1.0 - 1.1.1.255
CIDR: 1.1.1.0/24
Name: APNIC-LABS
Type: ASSIGNED PORTABLE
Country: AU
IP Version: v4
Objects: 3
The tool may display:
-
Network range
-
Network CIDR
-
Start IP
-
End IP
-
IP version
-
Network name
-
Allocation type
-
Country
-
ASN information, when available
-
Related RDAP links
-
Registration events
-
Network status
-
Notices
-
Remarks
-
Contact objects
-
E-mail addresses
-
Phone numbers
-
Physical addresses
-
Raw JSON response
-
Local query history
🧩 Supported Input
IP WHOIS supports direct lookup of IP addresses only.
Supported input types:
-
IPv4
-
IPv6
Valid examples:
1.1.1.1
8.8.8.8
2606:4700:4700::1111
2001:4860:4860::8888
Unsupported examples:
example.com
https://1.1.1.1
1.1.1.1/24
cloudflare.com
localhost
999.999.999.999
Important validation rule:
Only IPv4 or IPv6.
The tool is not intended for domain WHOIS lookups. Domain names, URLs, hostnames, and CIDR ranges should be checked with other dedicated tools.
📊 Summary Section
The Summary section provides a compact overview of the IP lookup result.
Example:
1.1.1.0 - 1.1.1.255
ASN —
CIDR 1.1.1.0/24
Entities: 0
22:42:09
Typical fields include:
| Field | Description |
|---|---|
| Range | The IP range containing the queried address |
| ASN | Autonomous System Number, if available |
| CIDR | Network block in CIDR notation |
| Entities | Number of related objects or contacts |
| Time | Lookup or display time |
The Summary section is useful for quick triage. It allows analysts to understand the basic network assignment without opening the full raw response.
🧾 Query Details
The Query section displays the main lookup data returned for the IP address and associated network.
Example:
Query: 1.1.1.0 - 1.1.1.255
ASN: —
ASN CIDR: —
ASN CC: —
ASN Registry: —
ASN Date: —
ASN Description: —
Entities Count: 0
Network CIDR: 1.1.1.0/24
Start: 1.1.1.0
End: 1.1.1.255
IP Version: v4
This section helps users separate the queried IP from the larger network block it belongs to.
🌐 Network Information
The network block describes the IP allocation or assignment returned by RDAP / WHOIS.
Example:
Name: APNIC-LABS
Type: ASSIGNED PORTABLE
Network: ASSIGNED PORTABLE
Handle: 1.1.1.0 - 1.1.1.255
Parent: -
CIDR: 1.1.1.0/24
Start: 1.1.1.0
End: 1.1.1.255
Version: v4
Country: AU
Name
The network name identifies the registered network object.
Example:
APNIC-LABS
The name may represent a registry project, organization, network allocation, ISP block, cloud provider range, hosting provider range, enterprise network, research prefix, or another registered resource.
Type
The type field describes the allocation or assignment category.
Example:
ASSIGNED PORTABLE
Common type values may include:
-
ALLOCATED
-
ASSIGNED
-
ASSIGNED PORTABLE
-
DIRECT ALLOCATION
-
DIRECT ASSIGNMENT
-
LEGACY
-
RESERVED
-
PROVIDER AGGREGATABLE
The exact values depend on the registry and RDAP source.
Handle
The handle is the identifier of the network object.
Example:
1.1.1.0 - 1.1.1.255
In some registries, the handle may be a textual object ID. In other cases, it may resemble the network range itself.
Parent
The parent field shows the parent network object if one is available.
Example:
Parent: -
A missing parent value does not necessarily mean that no broader allocation exists. It may simply mean that the source did not expose parent information in the returned object.
CIDR
CIDR shows the network prefix that contains the queried IP address.
Example:
1.1.1.0/24
CIDR is useful for:
-
firewall rules;
-
network grouping;
-
threat intelligence enrichment;
-
infrastructure mapping;
-
abuse escalation;
-
IP block analysis;
-
understanding the size of the allocation.
Start and End
Start and End define the first and last IP addresses in the returned network range.
Example:
Start: 1.1.1.0
End: 1.1.1.255
This helps users understand whether a suspicious IP belongs to a small network, a large provider allocation, a cloud range, or a specific assigned block.
IP Version
The version field identifies whether the network is IPv4 or IPv6.
Example:
Version: v4
Possible values:
v4
v6
Country
The country field displays the country code associated with the network registration.
Example:
Country: AU
Important note: the country value in WHOIS / RDAP data does not always represent the physical location of the server. It may represent the registration country, registry region, organization address, or administrative contact location.
For accurate infrastructure geolocation, the country field should be compared with IP geolocation, routing data, ASN information, DNS records, latency, and other technical signals.
🛰️ ASN Information
ASN data describes the Autonomous System associated with an IP address, when available.
The tool may display:
-
ASN
-
ASN CIDR
-
ASN country code
-
ASN registry
-
ASN date
-
ASN description
Example:
ASN: AS13335
ASN CIDR: 1.1.1.0/24
ASN CC: AU
ASN Registry: APNIC
ASN Date: 2011-08-11
ASN Description: CLOUDFLARENET
In some responses, ASN fields may be unavailable.
Example:
ASN: —
ASN CIDR: —
ASN CC: —
ASN Registry: —
ASN Date: —
ASN Description: —
Missing ASN data does not always mean that the IP is not routed. It may mean that the selected RDAP / WHOIS response did not include ASN enrichment.
For complete routing analysis, ASN data should be verified with BGP, RPKI, route collectors, passive DNS, and external network intelligence sources.
🔗 Links
The Links section displays RDAP or registry URLs related to the network or entity objects.
Example:
https://rdap.apnic.net/entity/AIC3-AP
Links are useful for:
-
opening the original registry record;
-
verifying NiamonX-parsed data against the source;
-
reviewing full RDAP entity pages;
-
checking related organization records;
-
copying references into investigation reports.
Interface hint:
Hover your cursor over the open link icon to open the link in a new tab.
📅 Events
Events describe registration-related actions associated with the network or contact objects.
Possible event types may include:
-
registration;
-
last changed;
-
last updated;
-
allocation;
-
assignment;
-
validation;
-
expiration, where applicable.
Example display:
Events:
action — -
action — -
Some RDAP responses contain complete event dates. Others may return incomplete or minimal event objects.
Events are useful for:
-
checking when a network was registered;
-
identifying recent ownership or metadata changes;
-
supporting timeline analysis;
-
enriching incident reports;
-
assessing whether infrastructure appears newly created or long-standing.
Important note: event availability depends on the source registry. Not every RDAP / WHOIS response includes complete event data.
✅ Status
The Status section shows the current state of the network object.
Example:
Status: active
Common statuses may include:
-
active;
-
allocated;
-
assigned;
-
validated;
-
reserved;
-
deprecated;
-
transferred;
-
locked;
-
inactive.
Status values depend on the registry and RDAP implementation.
A status such as active usually means the registration object is currently active in the registry database. It does not automatically mean that every IP inside the range is currently reachable, safe, or in use.
📌 Notices
Notices contain registry-provided informational messages, legal notices, terms of use, source information, or disclaimers.
Example:
Notices: No
If notices are present, they may include:
-
registry terms;
-
copyright statements;
-
acceptable use notices;
-
rate limit warnings;
-
referral information;
-
data accuracy notes;
-
RDAP service disclaimers.
Users should review notices when using WHOIS / RDAP data in legal, compliance, or official reporting workflows.
📝 Remarks
Remarks contain additional registry-provided descriptions or notes about the network.
Example:
description:
APNIC and Cloudflare DNS Resolver project,
Routed globally by AS13335/Cloudflare,
Research prefix for APNIC Labs

remarks:
---------------
All Cloudflare abuse reporting can be done via
resolver-abuse@cloudflare.com
---------------
Remarks are often highly valuable because they may contain:
-
project descriptions;
-
abuse reporting instructions;
-
routing notes;
-
service explanations;
-
operational comments;
-
special handling instructions;
-
registry-specific context.
For investigations, remarks should be reviewed carefully. They may contain the correct abuse escalation channel even when the main contact object is generic.
👥 Objects and Contacts
The Objects section shows related RDAP entities such as organizations, abuse contacts, administrative contacts, technical contacts, NOC contacts, and registrants.
Example:
Objects: 3
Objects may include:
-
organization;
-
registrant;
-
abuse contact;
-
administrative contact;
-
technical contact;
-
infrastructure contact;
-
NOC contact;
-
group;
-
role account.
The tool supports searching and filtering objects by role.
Example:
Search...
Role: all
🧑💼 Example Contact Object
Example object:
AIC3-AP
APNICRANDNET Infrastructure Contact
Kind: group
Roles:
administrative
technical
E-mails:
research@apnic.net
Phones:
+61 7 3858 3100
Addresses:
6 Cordelia St South Brisbane QLD 4101
Links:
https://rdap.apnic.net/entity/AIC3-AP
A contact object may contain:
| Field | Description |
|---|---|
| Handle | Unique entity identifier |
| Name | Display name of the entity |
| Kind | Entity type, such as group or org |
| Roles | RDAP roles assigned to the entity |
| E-mails | Contact e-mail addresses |
| Phones | Listed phone numbers |
| Addresses | Postal or office addresses |
| Links | RDAP links for the entity |
| Status | Entity status, if available |
| Events | Entity registration or update events |
| Remarks | Additional registry-provided notes |
🏷️ RDAP Roles
Objects use standard RDAP role designations.
Common roles include:
| Role | Meaning |
|---|---|
| registrant | Organization or entity associated with the registration |
| administrative | Administrative contact |
| technical | Technical contact |
| abuse | Abuse reporting contact |
| noc | Network Operations Center contact |
| billing | Billing contact |
| registrar | Registrar-related entity |
| reseller | Reseller-related entity |
| sponsor | Sponsoring organization |
Example:
Roles:
administrative
technical
Another example:
Roles:
abuse
Roles are important for choosing the correct escalation path. For malicious activity, the abuse role is usually the most relevant contact type.
🚨 Abuse Contacts
Abuse contacts are used to report malicious, unauthorized, or harmful activity associated with an IP address or network.
Example:
IRT-APNICRANDNET-AU
Roles:
abuse
E-mails:
helpdesk@apnic.net
Abuse contacts may be used for reports related to:
-
phishing;
-
malware;
-
spam;
-
scanning;
-
brute-force attacks;
-
botnet activity;
-
fraud infrastructure;
-
credential theft;
-
impersonation pages;
-
abusive hosting;
-
command-and-control infrastructure.
Before sending an abuse report, users should collect supporting evidence such as timestamps, URLs, logs, packet captures, screenshots, HTTP headers, DNS data, and affected systems.
📤 Copy and Export Features
IP WHOIS supports data extraction features that help users move results into reports or external workflows.
Available actions may include:
-
Copy summary
-
Copy JSON
-
Copy contacts
-
Export contacts to CSV
-
View Raw JSON
These features are useful for:
-
incident reports;
-
SOC tickets;
-
case management systems;
-
legal documentation;
-
abuse reports;
-
compliance records;
-
internal escalation;
-
customer support cases;
-
threat intelligence enrichment.
📄 Export Contacts to CSV
The Export contacts to CSV function allows users to export aggregated contact information from the objects section.
The exported data may include:
-
object handle;
-
object name;
-
kind;
-
roles;
-
e-mail addresses;
-
phone numbers;
-
addresses;
-
links;
-
remarks.
This is useful when an investigation involves multiple entities and the analyst needs to preserve contact data in a structured format.
Example use cases:
-
exporting abuse contacts for reporting;
-
collecting technical contacts for escalation;
-
saving organization details for a case file;
-
sharing contact information with an internal SOC team;
-
building an investigation evidence package.
🧬 Raw JSON
The Raw JSON view displays the original structured response returned by the RDAP / WHOIS source.
Raw JSON is useful for:
-
advanced technical review;
-
verifying parsed fields;
-
debugging incomplete records;
-
extracting fields not shown in the UI;
-
preserving source data;
-
integrating with other systems;
-
evidence storage;
-
analyst validation.
When accuracy matters, users should compare the visual UI fields with the raw JSON response.
🕓 Local IP History
IP WHOIS stores recent IP lookups locally in the browser.
Example interface section:
IP History
Filter...
History helps users:
-
repeat previous lookups;
-
filter investigated IPs;
-
continue an investigation session;
-
compare multiple IPs;
-
avoid retyping addresses.
Since the history is stored locally, it may be removed when browser data is cleared. It may also not sync between devices or browser profiles.
Security recommendation: clear local history on shared or untrusted devices when investigating sensitive IPs, customer incidents, or confidential infrastructure.
🔎 Common Use Cases
IP WHOIS supports many practical cybersecurity and OSINT workflows.
IP Ownership Investigation
Identify the registered network, organization, allocation type, and contact objects associated with an IP address.
SOC Alert Triage
Enrich suspicious IP addresses from alerts, logs, firewall events, EDR detections, IDS events, or SIEM correlations.
Abuse Reporting
Find abuse contacts and supporting registration details for reporting malicious activity.
Phishing Infrastructure Analysis
Investigate IP addresses hosting phishing pages, fake login portals, clone websites, or malicious redirects.
Malware Infrastructure Review
Check IP addresses linked to malware delivery, command-and-control servers, botnets, or payload hosting.
Brand Protection
Identify infrastructure behind impersonation websites, fake stores, unauthorized brand pages, or fraudulent campaigns.
Network Troubleshooting
Check which network block an IP belongs to and review registration details.
Threat Intelligence Enrichment
Add WHOIS / RDAP context to indicators of compromise.
Compliance and Audit
Preserve registration data for investigation files, audit trails, incident documentation, or legal review.
OSINT Research
Map public infrastructure, investigate hosting providers, and identify related contact entities.
🧠 Practical Investigation Workflow
A recommended IP WHOIS workflow should follow these steps.
1. Enter a Valid IP Address
Use only IPv4 or IPv6.
Example:
1.1.1.1
Avoid domains, URLs, hostnames, and CIDR input.
2. Review the Summary
Check the returned range, CIDR, ASN, entity count, and lookup time.
Example:
Range: 1.1.1.0 - 1.1.1.255
CIDR: 1.1.1.0/24
Entities: 3
3. Review Network Details
Check the network name, allocation type, country, start IP, end IP, version, and handle.
Example:
Name: APNIC-LABS
Type: ASSIGNED PORTABLE
Country: AU
Version: v4
4. Check ASN Information
Example:
ASN Description: description of the autonomous system.
If ASN data is missing, verify routing information using additional BGP or ASN lookup tools.
5. Review Status and Events
Check whether the network is active and whether registration or update events are available.
Example:
Network Status: active
Events can support timeline analysis and help identify recent changes.
6. Inspect Remarks
Read remarks carefully because they may contain special instructions, abuse reporting information, routing notes, or project descriptions.
Example:
All Cloudflare abuse reporting can be done via resolver-abuse@cloudflare.com
7. Inspect Objects and Roles
Important roles:
abuse
administrative
technical
registrant
noc
For reporting malicious activity, prioritize abuse contacts.
8. Copy or Export Data
Use copy and export features to preserve results.
Recommended items to save:
IP address
Network range
CIDR
Network name
Country
ASN data
Status
Events
Remarks
Contact objects
Abuse e-mails
Raw JSON
Lookup timestamp
9. Validate With Additional Evidence
For professional investigations, combine IP WHOIS data with:
-
DNS records;
-
passive DNS;
-
HTTP headers;
-
TLS certificate data;
-
screenshots;
-
webpage captures;
-
malware logs;
-
SIEM events;
-
firewall logs;
-
BGP routing data;
-
ASN intelligence;
-
geolocation data;
-
threat intelligence feeds.
WHOIS / RDAP data is only one part of the investigation.
📌 Field Interpretation Guide
ASN Description
The ASN Description field describes the autonomous system, when available.
Example meaning:
Description of the autonomous system.
This may identify an ISP, cloud provider, hosting provider, enterprise network, CDN, or other routing organization.
Network Status
Network Status shows the current status values associated with the network object.
Example:
active
Status values can indicate whether the object is active, allocated, assigned, reserved, or otherwise marked by the registry.
Events
Events show registration and change-related dates when the source provides them.
Possible examples:
registration
last changed
last updated
Events are useful for understanding when the object was created or modified.
Objects
Objects represent entities connected to the network.
Examples:
org
abuse
admin
technical
noc
registrant
Objects follow standard RDAP role designations and may contain names, e-mails, phones, addresses, links, statuses, events, and remarks.
⚠️ Limitations and Important Notes
WHOIS / RDAP data should be interpreted carefully.
Important limitations:
-
WHOIS / RDAP data may be incomplete.
-
ASN data may be missing from some responses.
-
Contact information may be outdated.
-
Some registries redact personal data.
-
Some records contain generic abuse contacts.
-
Country fields do not always indicate server location.
-
Cloud and CDN IPs may represent shared infrastructure.
-
Hosting providers may assign IPs to many different customers.
-
The listed organization may not be the actual end user.
-
Dynamic IPs may change ownership or customer assignment.
-
Events may be incomplete or unavailable.
-
RDAP sources may return inconsistent field names.
-
Server-side errors may occur.
-
Some registries may rate-limit or temporarily fail.
In case of a server-side 500 error, repeat the request.
Example note:
In case of a 500 error on the server side, please repeat your request.
🛡️ Security, Privacy & Responsible Use
IP WHOIS is intended for lawful cybersecurity, OSINT, compliance, reporting, infrastructure analysis, and network investigation workflows.
Acceptable use cases include:
-
checking your own IP infrastructure;
-
investigating suspicious IP addresses;
-
enriching SOC alerts;
-
identifying abuse contacts;
-
preparing abuse reports;
-
reviewing public registration data;
-
mapping public network ownership;
-
supporting incident response;
-
documenting threat intelligence findings;
-
validating public infrastructure records.
Users should follow responsible use principles:
-
Do not harass contacts listed in WHOIS / RDAP data.
-
Use abuse contacts only for legitimate abuse reports.
-
Include clear evidence when submitting reports.
-
Do not treat WHOIS data as definitive proof of attribution.
-
Do not expose sensitive investigation notes unnecessarily.
-
Store exported contact data securely.
-
Respect registry terms and privacy restrictions.
-
Validate critical findings with multiple independent sources.
WHOIS / RDAP data can support investigations, but it should not be used alone to accuse an organization or individual of malicious activity.
🧾 Recommended Abuse Report Context
When using IP WHOIS to prepare an abuse report, include enough evidence for the receiving team to understand and verify the issue.
Recommended report fields:
Source IP: 1.1.1.1
Observed activity: phishing / malware / scanning / spam / abuse
Timestamp with timezone: 17.06.2026, 22:42:09
Affected system or URL: relevant target
Evidence: logs, screenshots, headers, URLs, samples
WHOIS range: 1.1.1.0 - 1.1.1.255
CIDR: 1.1.1.0/24
Network name: APNIC-LABS
Abuse contact: listed abuse e-mail
Additional notes: analyst summary
A high-quality abuse report should be factual, concise, and evidence-based.
⚙️ Technical Highlights
-
IP WHOIS / RDAP lookup tool
-
Available at
dash.niamonx.io/ip_whois -
Supports IPv4 and IPv6 validation
-
Retrieves public IP registration data
-
Displays network range
-
Displays CIDR block
-
Displays start and end IP
-
Shows IP version
-
Shows network name
-
Shows allocation or assignment type
-
Shows country code
-
Shows ASN fields when available
-
Shows ASN description when available
-
Shows entity count
-
Displays RDAP links
-
Displays registration events
-
Displays network status
-
Displays notices
-
Displays remarks
-
Displays related objects and contacts
-
Supports object search
-
Supports role filtering
-
Aggregates contact e-mails
-
Aggregates phone numbers
-
Shows physical addresses when available
-
Allows copying summary
-
Allows copying JSON
-
Allows copying contacts
-
Supports contact export to CSV
-
Provides Raw JSON view
-
Stores IP history locally
-
Suitable for OSINT, SOC, incident response, abuse reporting, infrastructure mapping, and threat intelligence
📌 Usage Hints
-
Enter only a valid IPv4 or IPv6 address.
-
Do not enter domains, URLs, hostnames, or CIDR ranges.
-
Use the Summary section for quick triage.
-
Use the Network section to understand the assigned range.
-
Check CIDR before creating firewall or detection rules.
-
Review ASN Description to understand the autonomous system.
-
Review Network Status to understand the current object state.
-
Review Events for registration and update context.
-
Review Objects to find organization, abuse, administrative, and technical contacts.
-
Use role filtering to focus on abuse or technical contacts.
-
Check Remarks for special reporting instructions.
-
Open RDAP links to verify source records.
-
Copy summary for reports.
-
Copy JSON for technical analysis.
-
Export contacts to CSV for case management.
-
Use Raw JSON when parsed UI data appears incomplete.
-
Repeat the request if a server-side 500 error occurs.
-
Treat WHOIS / RDAP data as supporting evidence, not final attribution.
-
Combine results with DNS, HTTP, TLS, BGP, passive DNS, and threat intelligence data.
📬 Contact Information
For technical, legal, abuse, privacy, or support-related inquiries, users can contact the NiamonX team directly:
support@niamonx.io — Technical Support
other@niamonx.io — General Inquiries
takedown@niamonx.io — Privacy or Data Removal Requests
legal@niamonx.io — Legal and Compliance Matters
Alternative contact channel:
🔗 Helpdesk: https://support.niamonx.io/
Summary
NiamonX IP WHOIS is an RDAP / WHOIS lookup tool for IPv4 and IPv6 addresses. It provides structured IP registration intelligence, including network range, CIDR, start and end IP, IP version, network name, allocation type, country, ASN fields, status, events, notices, remarks, RDAP links, related objects, contacts, e-mails, phone numbers, addresses, raw JSON, local history, copy options, and CSV export.
The tool is designed for OSINT research, SOC workflows, incident response, abuse reporting, phishing investigations, malware infrastructure analysis, brand protection, compliance documentation, network troubleshooting, and threat intelligence enrichment. Results should be interpreted as public registration context and combined with additional technical evidence before making conclusions about ownership, infrastructure usage, or attribution.
Subdomains Extended | Subdomain Discovery & DNS Inventory Tool
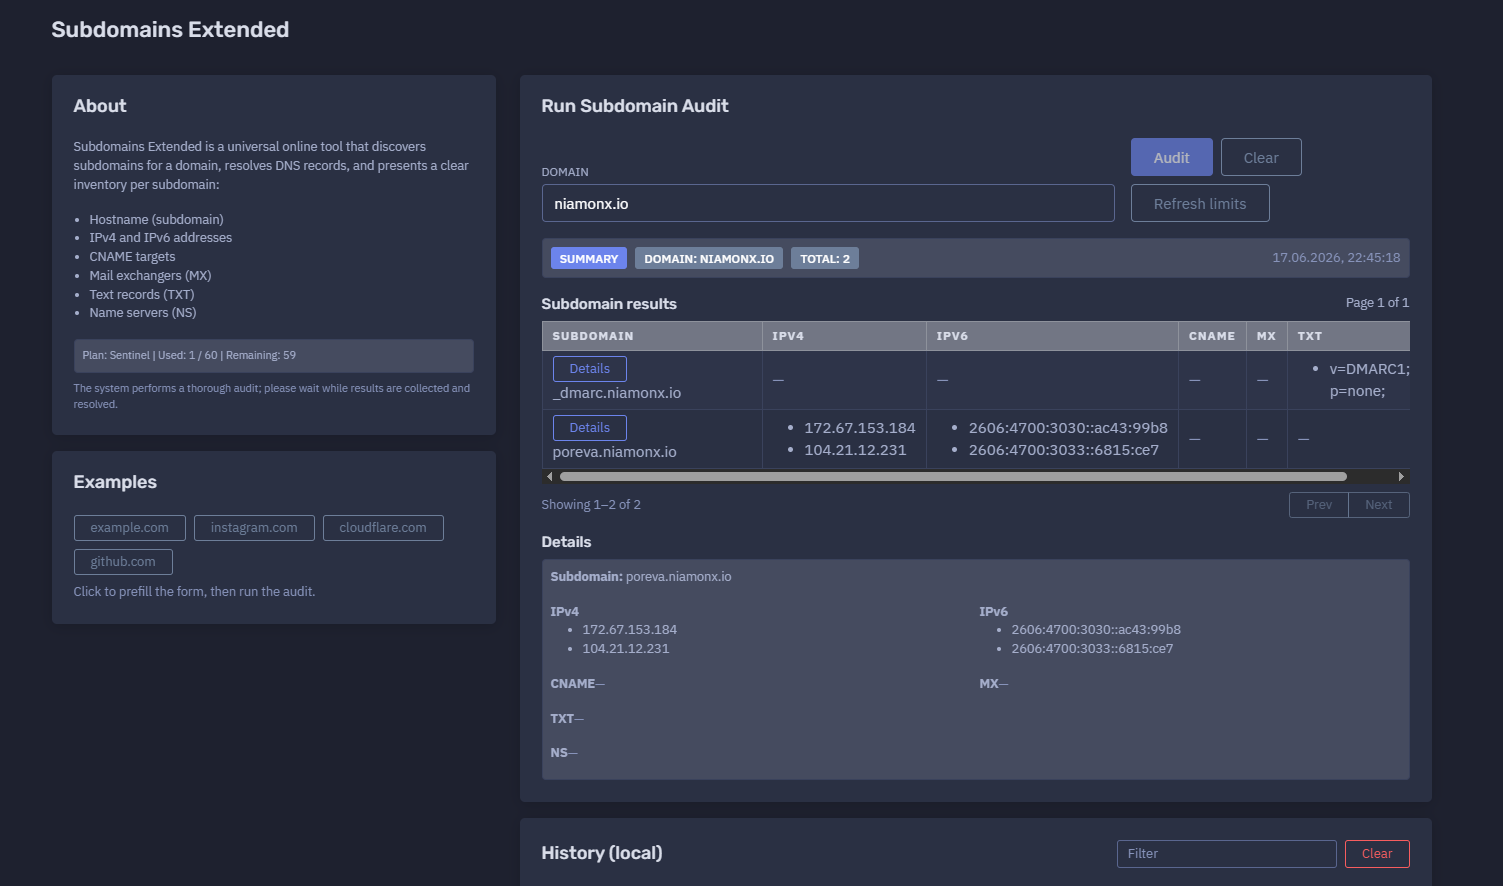
The platform available at https://dash.niamonx.io/subdomains_extended — known as Subdomains Extended — is a domain intelligence and DNS inventory tool within the NiamonX platform. It discovers subdomains for a target domain, resolves DNS records, and presents a clear technical inventory for each discovered hostname.
The tool helps users identify exposed subdomains, review DNS configuration, map public infrastructure, detect forgotten assets, verify mail and security-related records, and support OSINT, SOC, incident response, compliance, and attack surface management workflows.
Overview of the Service
Subdomains Extended is designed to perform a more detailed subdomain audit than a basic subdomain list. Instead of only returning discovered hostnames, it enriches each subdomain with DNS resolution data.
For every discovered subdomain, the tool may show:
-
Hostname
-
IPv4 addresses
-
IPv6 addresses
-
CNAME targets
-
MX records
-
TXT records
-
NS records
This makes the module useful not only for discovery, but also for understanding how each subdomain is connected to infrastructure, cloud services, mail systems, verification records, third-party services, CDN providers, and DNS delegation.
The tool is useful for:
-
OSINT analysts
-
SOC teams
-
Threat intelligence teams
-
Incident response teams
-
Bug bounty and security researchers
-
Brand protection teams
-
Compliance departments
-
System administrators
-
DevOps engineers
-
DNS administrators
-
Attack surface management teams
-
Infrastructure owners
-
Technical support teams
🔍 How the Tool Works
When a user enters a domain and starts an audit, Subdomains Extended searches for known or discoverable subdomains and resolves DNS records for each result.
Example audit input:
Domain: niamonx.io
Example summary result:
Domain: niamonx.io
Total: 2
17.06.2026, 22:45:18
Example discovered subdomains:
_dmarc.niamonx.io
poreva.niamonx.io
Example resolved DNS data:
poreva.niamonx.io
IPv4:
172.67.153.184
104.21.12.231

IPv6:
2606:4700:3030::ac43:99b8
2606:4700:3033::6815:ce7
The system performs a thorough audit and may require time to collect, resolve, and organize results.
Example interface note:
The system performs a thorough audit; please wait while results are collected and resolved.
🧩 What Can Be Audited
Subdomains Extended accepts a root domain as input.
Valid examples:
niamonx.io
example.com
company.org
security.example.net
Unsupported or invalid examples:
https://niamonx.io
http://example.com/page
192.168.1.1
user@example.com
localhost
*.example.com
Recommended input format:
domain.tld
Users should enter only the domain name, without protocol, path, wildcard prefix, query parameters, or URL fragments.
⚙️ Main Audit Function
Run Subdomain Audit
The main action starts the subdomain discovery and DNS resolution process.
Example:
Run Subdomain Audit
Domain: niamonx.io
After running the audit, the tool returns a summary and a structured table of discovered subdomains with DNS records.
The audit may include:
-
subdomain discovery;
-
DNS resolution;
-
IPv4 lookup;
-
IPv6 lookup;
-
CNAME lookup;
-
MX lookup;
-
TXT lookup;
-
NS lookup;
-
result grouping;
-
local history storage.
🚦 Plan Limits and Usage
Subdomains Extended uses plan-based query limits.
Example:
Plan: Sentinel
Used: 1 / 60
Remaining: 59
Important points:
-
Each audit may consume plan quota.
-
Query limits depend on the active user plan.
-
More thorough audits may require more processing time.
-
Large domains may produce more results.
-
DNS resolution may take longer for domains with many records.
-
Repeated audits may consume additional quota.
-
Results may change over time because DNS and subdomain exposure are dynamic.
Users should monitor remaining queries when auditing multiple domains, customer assets, investigation targets, or large infrastructure footprints.
📊 Summary Section
The Summary section provides a compact overview of the audit result.
Example:
Domain: niamonx.io
Total: 2
17.06.2026, 22:45:18
Typical fields include:
| Field | Description |
|---|---|
| Domain | The audited root domain |
| Total | Number of discovered subdomains |
| Timestamp | Date and time when the audit was completed |
The Summary section is useful for quick reporting and audit comparison. It allows users to see how many subdomains were discovered at a specific point in time.
📋 Subdomain Results Table
The Subdomain Results table displays discovered hostnames and their resolved DNS records.
Example table columns:
| Column | Description |
|---|---|
| Subdomain | Discovered hostname |
| IPv4 | A records resolved for the hostname |
| IPv6 | AAAA records resolved for the hostname |
| CNAME | Canonical name target |
| MX | Mail exchanger records |
| TXT | Text records |
| NS | Name server records |
Example result:
Subdomain: _dmarc.niamonx.io
IPv4: —
IPv6: —
CNAME: —
MX: —
TXT: v=DMARC1; p=none;
NS: —
Another example:
Subdomain: poreva.niamonx.io
IPv4:
172.67.153.184
104.21.12.231

IPv6:
2606:4700:3030::ac43:99b8
2606:4700:3033::6815:ce7

CNAME: —
MX: —
TXT: —
NS: —
If a record type is not available, the interface displays:
—
This means that no value was returned for that specific DNS record type during the audit.
🔎 Result Pagination
For domains with many discovered subdomains, results may be paginated.
Example:
Page 1 of 1
Showing 1–2 of 2
Pagination helps keep the interface readable when auditing larger domains.
Possible pagination information includes:
-
current page;
-
total pages;
-
visible result range;
-
total discovered subdomains.
For large domains, users should review all pages to avoid missing important records.
🧾 Details Panel
The Details panel shows a focused view of one selected subdomain.
Example:
Details
Subdomain: poreva.niamonx.io
IPv4:
172.67.153.184
104.21.12.231
IPv6:
2606:4700:3030::ac43:99b8
2606:4700:3033::6815:ce7
CNAME: —
MX: —
TXT: —
NS: —
The Details panel is useful when a subdomain has many records or when the user needs to copy, inspect, or document a specific hostname.
🌐 Hostname
The Hostname field shows the discovered subdomain.
Example:
poreva.niamonx.io
Hostnames may represent:
-
public websites;
-
API endpoints;
-
staging environments;
-
development systems;
-
mail-related records;
-
CDN endpoints;
-
third-party service integrations;
-
verification records;
-
delegated DNS zones;
-
forgotten or legacy assets.
Subdomain discovery is useful because organizations often expose services across many hostnames that are not visible from the main website.
🌍 IPv4 Records
IPv4 records show A records resolved for the subdomain.
Example:
172.67.153.184
104.21.12.231
IPv4 results help identify:
-
hosting providers;
-
CDN usage;
-
public-facing infrastructure;
-
shared IP ranges;
-
possible origin exposure;
-
network ownership;
-
security monitoring targets;
-
firewall or allowlist candidates.
A subdomain can resolve to one IPv4 address or multiple IPv4 addresses. Multiple addresses may indicate load balancing, CDN usage, high availability, or provider-managed routing.
🌐 IPv6 Records
IPv6 records show AAAA records resolved for the subdomain.
Example:
2606:4700:3030::ac43:99b8
2606:4700:3033::6815:ce7
IPv6 results help users identify modern dual-stack infrastructure.
IPv6 records are important because:
-
services may be reachable over IPv6 even when IPv4 is restricted;
-
firewall policies may differ between IPv4 and IPv6;
-
monitoring may miss IPv6 exposure;
-
misconfigured IPv6 services can create security gaps;
-
CDN and cloud services often publish IPv6 records automatically.
Security teams should review both IPv4 and IPv6 records when assessing exposure.
🔁 CNAME Records
CNAME records show canonical name targets for a subdomain.
Example:
CNAME: app.example.hosting-provider.com
CNAME records are useful for identifying:
-
third-party services;
-
SaaS integrations;
-
CDN aliases;
-
cloud-hosted applications;
-
landing page platforms;
-
verification targets;
-
takeover risk indicators;
-
redirected service ownership.
A missing CNAME is displayed as:
CNAME: —
Important security note: abandoned or misconfigured CNAME records may sometimes indicate potential subdomain takeover risk, especially when pointing to a third-party service that is no longer configured. Such findings should be validated carefully and responsibly.
📬 MX Records
MX records show mail exchangers associated with a subdomain.
Example:
MX: mail.example.com
MX records are useful for:
-
mail infrastructure mapping;
-
identifying mail providers;
-
detecting mail routing configuration;
-
reviewing security posture;
-
understanding subdomain-specific mail behavior;
-
verifying whether a subdomain can receive mail.
A missing MX record is displayed as:
MX: —
For most normal application subdomains, MX records may be absent. This is expected.
🧾 TXT Records
TXT records show text-based DNS records associated with a subdomain.
Example:
v=DMARC1; p=none;
TXT records may contain:
-
DMARC policies;
-
SPF records;
-
DKIM selectors;
-
domain verification records;
-
security policies;
-
ownership verification tokens;
-
service integration tokens;
-
configuration metadata.
Example discovered record:
Subdomain: _dmarc.niamonx.io
TXT: v=DMARC1; p=none;
TXT records are especially important for e-mail security and domain ownership verification.
Security teams should review TXT records for:
-
weak DMARC policies;
-
overly permissive SPF rules;
-
outdated verification tokens;
-
exposed internal metadata;
-
third-party service dependencies;
-
misconfigured mail security settings.
🛡️ DMARC Records
Subdomains Extended may discover DMARC-related records such as _dmarc.domain.tld.
Example:
_dmarc.niamonx.io
TXT: v=DMARC1; p=none;
DMARC records are used to define domain-level e-mail authentication policy.
A DMARC value such as:
v=DMARC1; p=none;
means that DMARC is present, but the policy is monitoring-only. It does not instruct receivers to quarantine or reject failing messages.
Common DMARC policies include:
| Policy | Meaning |
|---|---|
| p=none | Monitor only |
| p=quarantine | Treat failing mail as suspicious |
| p=reject | Reject failing mail |
For stronger protection against spoofing, organizations often move from p=none to p=quarantine or p=reject after monitoring and validation.
🧭 NS Records
NS records show name servers associated with a subdomain or delegated zone.
Example:
NS: ns1.example.net
NS records are useful for:
-
identifying delegated subdomains;
-
mapping DNS providers;
-
finding separate DNS zones;
-
reviewing infrastructure ownership;
-
detecting forgotten delegations;
-
identifying third-party DNS dependencies.
A missing NS record is displayed as:
NS: —
Delegated subdomains are important during security reviews because they may be managed separately from the main domain and may have different access controls, owners, or providers.
📚 Examples Section
The tool includes examples that can prefill the audit form.
Example interface note:
Examples
Click to prefill the form, then run the audit.
Examples help users quickly understand the correct input format and run a test audit without manually typing a domain.
🕓 Local History
Subdomains Extended stores recent audits locally in the user’s browser.
Example:
History (local)
Filter
Stored only in your browser (last 50 audits).
Example history item:
niamonx.io
Total: 2
17.06.2026, 22:45:18
Local history helps users:
-
repeat previous audits;
-
compare recent results;
-
continue an investigation session;
-
quickly return to previously checked domains;
-
filter audit history;
-
preserve local workflow context.
Because history is stored only in the browser, it may be removed when browser data is cleared, a different browser profile is used, or the user switches devices.
🔐 Why Subdomain Discovery Matters
Subdomains are often part of an organization’s public attack surface. Even when the main website is secure, exposed subdomains may reveal additional systems, legacy applications, development environments, staging panels, APIs, authentication portals, cloud services, or forgotten infrastructure.
Subdomain discovery helps identify:
-
forgotten services;
-
exposed staging environments;
-
abandoned DNS records;
-
third-party integrations;
-
cloud-hosted applications;
-
vulnerable legacy systems;
-
shadow IT assets;
-
takeover-prone CNAME records;
-
mail security records;
-
DNS delegation risks;
-
undocumented public infrastructure.
A complete subdomain inventory is an important foundation for attack surface management and defensive security.
🔎 Common Use Cases
Attack Surface Inventory
Create a list of public-facing subdomains and their DNS records to understand the visible infrastructure of a domain.
OSINT Research
Map publicly discoverable domain infrastructure during open-source intelligence investigations.
SOC Triage
Enrich alerts involving suspicious hostnames, unknown subdomains, or unusual DNS activity.
Incident Response
Check whether a suspicious subdomain is part of an organization’s known infrastructure.
Brand Protection
Identify suspicious, forgotten, or unexpected subdomains that may be used in impersonation, phishing, or brand abuse investigations.
Subdomain Takeover Review
Review CNAME records that point to third-party services and verify whether they are still properly configured.
DNS Security Audit
Inspect DNS records, including TXT, MX, NS, IPv4, and IPv6 records, for misconfigurations or unexpected exposure.
E-mail Security Review
Find DMARC, SPF, DKIM, MX, and TXT-related records that affect e-mail authentication and spoofing protection.
Cloud and CDN Mapping
Identify subdomains resolving to cloud providers, CDN endpoints, managed platforms, or external infrastructure.
Compliance Documentation
Create a record of public DNS exposure for compliance reviews, asset inventories, and audit documentation.
DevOps and Infrastructure Review
Help engineering teams identify public DNS entries and validate whether they match the intended infrastructure state.
🧠 Recommended Audit Workflow
A practical Subdomains Extended workflow should follow these steps.
1. Enter the Domain
Use only the domain name.
Example:
niamonx.io
Do not include:
https://
http://
/path
?query=value
#fragment
*
2. Run the Audit
Start the audit using the main action button.
Example:
Run Subdomain Audit
The tool will collect discovered subdomains and resolve their DNS records.
3. Review the Summary
Check the audited domain, total number of discovered subdomains, and timestamp.
Example:
Domain: niamonx.io
Total: 2
17.06.2026, 22:45:18
This gives a quick overview of the result set.
4. Review the Subdomain Table
Inspect each discovered hostname and its DNS records.
Important columns:
Subdomain
IPv4
IPv6
CNAME
MX
TXT
NS
Look for unexpected records, unknown hostnames, third-party dependencies, mail records, and delegated zones.
5. Open Details for Important Subdomains
Use the Details panel to inspect a selected subdomain more closely.
Example:
Subdomain: poreva.niamonx.io
IPv4:
172.67.153.184
104.21.12.231
IPv6:
2606:4700:3030::ac43:99b8
2606:4700:3033::6815:ce7
6. Review CNAME Records
CNAME records are especially important for third-party service mapping and takeover-risk review.
Questions to ask:
-
Does the CNAME point to a known provider?
-
Is the third-party service still active?
-
Is the target properly configured?
-
Is the subdomain still needed?
-
Does ownership of the service match the organization?
7. Review TXT Records
TXT records can reveal mail policies, verification records, and security configuration.
Important records to review:
DMARC
SPF
DKIM
domain verification
service ownership tokens
Example:
v=DMARC1; p=none;
8. Review MX Records
MX records should be checked to understand mail routing and possible subdomain-specific mail handling.
Questions to ask:
-
Does this subdomain need to receive mail?
-
Is the mail provider expected?
-
Are mail records consistent with the organization’s policy?
-
Are unused mail routes exposed?
9. Review NS Records
NS records may indicate delegated subdomains.
Questions to ask:
-
Is this subdomain intentionally delegated?
-
Who manages the delegated zone?
-
Is the DNS provider still active?
-
Are there stale delegations?
-
Does the delegated zone follow the same security standards?
10. Compare With Asset Inventory
Compare discovered results against the organization’s official asset list.
Focus on:
-
unknown subdomains;
-
unowned services;
-
staging environments;
-
legacy systems;
-
abandoned records;
-
cloud services;
-
unexpected IPs;
-
missing documentation.
11. Save or Document Findings
For professional workflows, document important results with timestamp and context.
Recommended record:
Domain: niamonx.io
Audit time: 17.06.2026, 22:45:18
Total subdomains: 2
Subdomain: poreva.niamonx.io
IPv4: 172.67.153.184, 104.21.12.231
IPv6: 2606:4700:3030::ac43:99b8, 2606:4700:3033::6815:ce7
CNAME: —
MX: —
TXT: —
NS: —
🚨 Security Review Checklist
When using Subdomains Extended for security auditing, review the following areas.
Unknown Subdomains
Check whether every discovered subdomain is known and authorized.
Questions:
-
Who owns this subdomain?
-
Which team manages it?
-
Is it documented?
-
Is it still required?
-
Does it expose a service?
Staging and Development Systems
Look for names such as:
dev
test
stage
staging
qa
uat
demo
internal
admin
panel
backup
old
legacy
Such systems are often less protected than production environments and may expose sensitive data or outdated software.
CNAME Takeover Indicators
Review CNAME targets pointing to third-party services.
Potential risk indicators:
-
target service no longer exists;
-
provider returns an unclaimed service page;
-
DNS points to a deleted cloud resource;
-
subdomain exists but application is not configured;
-
service ownership cannot be verified.
Any suspected takeover risk should be validated safely and responsibly without exploiting the domain.
Mail Security Records
MX
SPF
DKIM
DMARC
Potential issues:
-
missing DMARC;
-
DMARC set to monitoring only;
-
overly broad SPF records;
-
outdated verification records;
-
unexpected mail providers;
-
inconsistent mail routing.
IPv6 Exposure
Check whether services are exposed through IPv6.
Important questions:
-
Is IPv6 intentionally enabled?
-
Are IPv6 firewall rules aligned with IPv4?
-
Are monitoring and logging systems covering IPv6?
-
Are IPv6 addresses expected?
IPv6 exposure is sometimes overlooked during security reviews.
Delegated DNS Zones
Review NS records for delegated subdomains.
Potential issues:
-
forgotten delegated zones;
-
third-party DNS provider risk;
-
expired provider accounts;
-
inconsistent security controls;
-
weak access management;
-
stale name server configuration.
📊 Interpreting Results Correctly
Subdomain audit results should be interpreted carefully.
Important notes:
-
A discovered subdomain does not automatically mean a vulnerability exists.
-
A missing DNS record does not always mean the subdomain is unused.
-
DNS data changes over time.
-
CDN IP addresses may be shared by many customers.
-
Cloud provider addresses may not identify the final application owner.
-
TXT records may contain sensitive service metadata.
-
CNAME records require manual validation before risk conclusions.
-
IPv4 and IPv6 exposure should both be reviewed.
-
Some subdomains may resolve differently depending on DNS resolver, region, or time.
-
Some records may be cached or temporarily unavailable.
-
Passive discovery may miss private or newly created subdomains.
-
DNS inventory should be combined with HTTP, TLS, WHOIS, ASN, and screenshot evidence.
Subdomains Extended provides strong DNS inventory context, but conclusions should be validated with additional tools and evidence.
🧾 Recommended Reporting Format
When documenting a subdomain audit, use a consistent format.
Example:
Domain: niamonx.io
Audit timestamp: 17.06.2026, 22:45:18
Total discovered subdomains: 2

Subdomain: _dmarc.niamonx.io
IPv4: —
IPv6: —
CNAME: —
MX: —
TXT: v=DMARC1; p=none;
NS: —

Subdomain: poreva.niamonx.io
IPv4: 172.67.153.184, 104.21.12.231
IPv6: 2606:4700:3030::ac43:99b8, 2606:4700:3033::6815:ce7
CNAME: —
MX: —
TXT: —
NS: —
For security reports, add analyst notes:
Finding: DMARC policy is set to p=none.
Impact: Monitoring-only policy does not instruct receivers to reject or quarantine failing messages.
Recommendation: Review DMARC reports and consider phased migration to p=quarantine or p=reject when ready.
🛡️ Security, Privacy & Responsible Use
Subdomains Extended is intended for lawful domain analysis, OSINT, cybersecurity, compliance, infrastructure review, and defensive security workflows.
Acceptable use cases include:
-
auditing domains you own or are authorized to test;
-
reviewing public DNS exposure;
-
mapping public infrastructure;
-
investigating suspicious subdomains;
-
supporting incident response;
-
reviewing mail security records;
-
documenting compliance evidence;
-
identifying forgotten assets;
-
checking third-party dependencies;
-
supporting brand protection investigations.
Users should follow responsible use principles:
-
Do not use the tool for unauthorized targeting or harassment.
-
Do not attempt to exploit discovered services.
-
Validate findings responsibly.
-
Do not claim a vulnerability based only on DNS data.
-
Do not abuse discovered contact or infrastructure information.
-
Store audit results securely when they involve client or sensitive domains.
-
Follow applicable laws, policies, and authorization boundaries.
-
Report security issues through proper disclosure channels.
Subdomain discovery is a legitimate defensive and OSINT technique, but it must be used responsibly.
⚙️ Technical Highlights
-
Subdomain discovery tool
-
Available at
dash.niamonx.io/subdomains_extended -
Performs extended subdomain audits
-
Resolves DNS records per subdomain
-
Shows hostnames
-
Shows IPv4 addresses
-
Shows IPv6 addresses
-
Shows CNAME records
-
Shows MX records
-
Shows TXT records
-
Shows NS records
-
Displays audit summary
-
Shows total discovered subdomains
-
Displays timestamped results
-
Supports result pagination
-
Provides per-subdomain details
-
Includes example-based form prefilling
-
Stores local audit history
-
Keeps last 50 audits in the browser
-
Supports local history filtering
-
Uses plan-based query limits
-
Suitable for OSINT, SOC, attack surface management, incident response, compliance, DNS review, and infrastructure mapping
📌 Usage Hints
-
Enter only the domain name, not a full URL.
-
Do not include
https://,http://, paths, query strings, or wildcard prefixes. -
Use the Summary section to check total discovered subdomains.
-
Review all result pages for large domains.
-
Open Details for important subdomains.
-
Check IPv4 and IPv6 records separately.
-
Review CNAME records for third-party dependencies.
-
Validate CNAME records for possible takeover risk.
-
Review MX records for mail routing.
-
Review TXT records for DMARC, SPF, DKIM, and verification tokens.
-
Review NS records for delegated zones.
-
Treat missing records as “not returned,” not always as proof of absence.
-
Compare discovered subdomains with the official asset inventory.
-
Repeat audits over time because DNS exposure changes.
-
Store important findings with timestamp and context.
-
Clear local history on shared devices when auditing sensitive domains.
-
Use results responsibly and within authorization boundaries.
📬 Contact Information
For technical, legal, abuse, privacy, or support-related inquiries, users can contact the NiamonX team directly:
support@niamonx.io — Technical Support
other@niamonx.io — General Inquiries
takedown@niamonx.io — Privacy or Data Removal Requests
legal@niamonx.io — Legal and Compliance Matters
Alternative contact channel:
🔗 Helpdesk: https://support.niamonx.io/
Summary
NiamonX Subdomains Extended is an extended subdomain discovery and DNS inventory tool for public domains. It discovers subdomains, resolves DNS records, and presents a structured view of hostnames, IPv4 addresses, IPv6 addresses, CNAME targets, MX records, TXT records, and NS records.
The tool is designed for OSINT research, attack surface management, SOC workflows, incident response, DNS security reviews, brand protection, compliance documentation, cloud and CDN mapping, e-mail security analysis, and infrastructure inventory. Results should be interpreted as point-in-time DNS intelligence and combined with additional technical evidence such as HTTP responses, TLS certificates, WHOIS data, ASN information, screenshots, passive DNS, and asset inventory records.
Subdomains Check | Subdomain Enumeration Tool
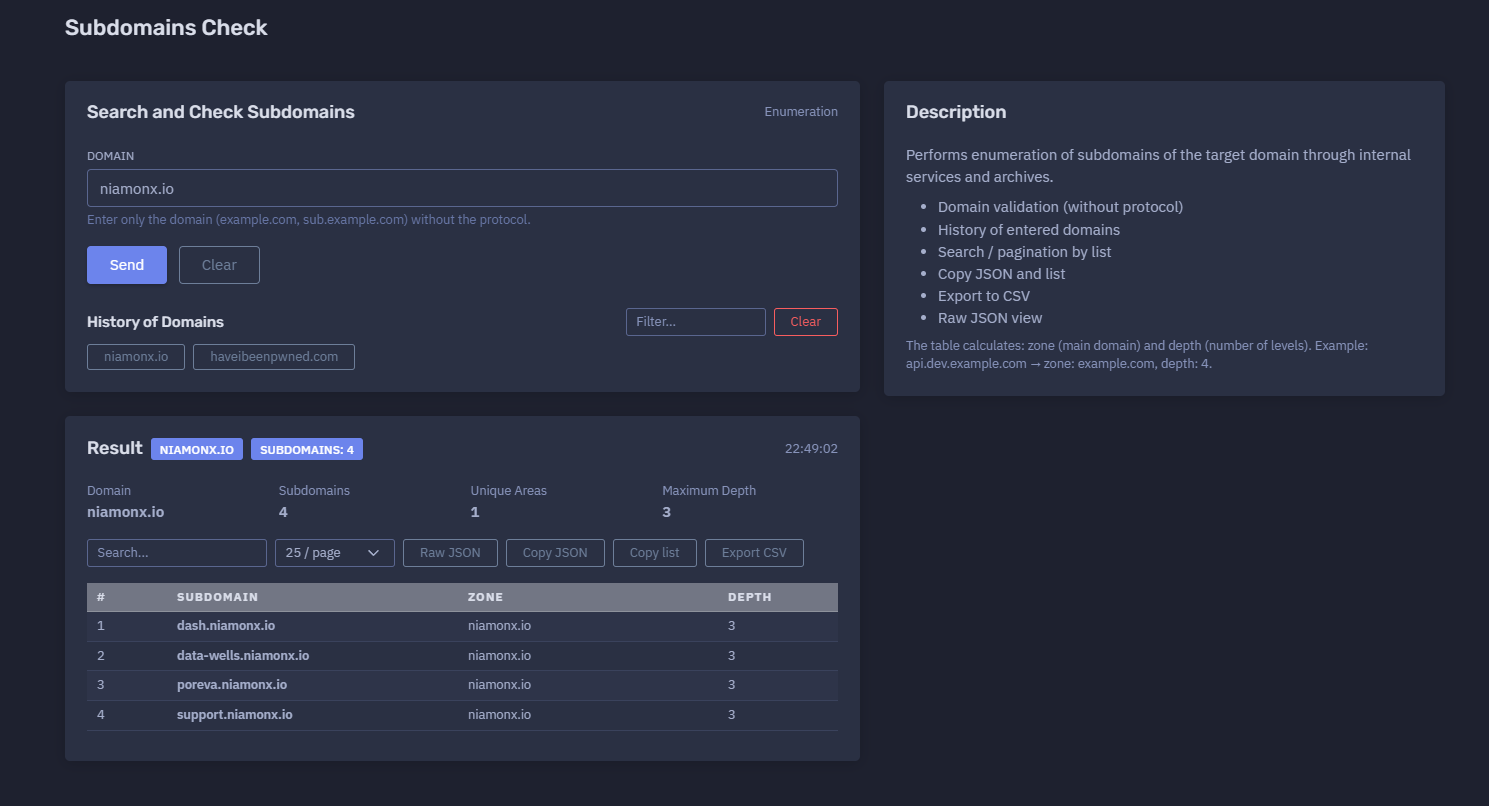
The platform available at https://dash.niamonx.io/subdomains_check — known as Subdomains Check — is a subdomain enumeration tool within the NiamonX platform. It helps users discover subdomains associated with a target domain by using internal services, archives, and available discovery sources. The tool returns a structured list of discovered hostnames and calculates useful metadata such as the main zone, subdomain depth, total number of subdomains, unique areas, and maximum depth.
Overview of the Service
Subdomains Check is designed to help users quickly enumerate known or discoverable subdomains for a domain. It provides a clean and focused inventory of hostnames without requiring the user to manually search archives, public datasets, or internal discovery sources.
The tool is useful for OSINT research, attack surface mapping, security audits, SOC workflows, incident response, brand protection, bug bounty reconnaissance, DNS inventory review, compliance checks, and infrastructure documentation.
Unlike tools that focus primarily on DNS resolution, Subdomains Check focuses on the discovery and organization of subdomain names. It helps users understand what hostnames exist or have been observed for a target domain and provides export options for further analysis.
The module is especially useful when users need to answer questions such as:
-
Which subdomains are known for this domain?
-
How many subdomains were discovered?
-
Which hostnames may belong to the same main zone?
-
How deep are the discovered subdomains?
-
Are there unexpected, forgotten, or suspicious hostnames?
-
Can the discovered list be copied, exported, or reviewed as raw JSON?
-
Can the results be filtered and paginated for easier analysis?
🔍 How the Tool Works
When a user enters a domain, Subdomains Check validates the input and performs enumeration through internal services and archives. The result is returned as a structured table of discovered subdomains.
Example input:
Domain: niamonx.io
Example result:
Domain: niamonx.io
Subdomains: 4
Unique Areas: 1
Maximum Depth: 3
22:49:02
Example discovered subdomains:
dash.niamonx.io
data-wells.niamonx.io
poreva.niamonx.io
support.niamonx.io
The tool calculates and displays:
-
discovered subdomain;
-
main zone;
-
hostname depth;
-
total subdomain count;
-
number of unique areas;
-
maximum depth;
-
query timestamp.
🧩 Supported Input
Subdomains Check accepts domain names only.
Correct input examples:
niamonx.io
example.com
sub.example.com
company.org
Incorrect input examples:
https://niamonx.io
http://example.com
https://example.com/path
*.example.com
user@example.com
192.168.1.1
localhost
The interface guidance is:
Enter only the domain (example.com, sub.example.com) without the protocol.
Users should not include:
https://
http://
/path
?query=value
#fragment
*
Recommended format:
domain.tld
⚙️ Main Function: Search and Check Subdomains
The main action performs subdomain enumeration for the entered domain.
Example:
Search and Check Subdomains
Domain: niamonx.io
After the query is processed, the tool returns a result summary and a searchable table of discovered hostnames.
The enumeration process may use:
-
internal discovery services;
-
archived records;
-
historical observations;
-
indexed subdomain sources;
-
platform-side enrichment logic.
This makes the tool useful for quickly building an initial subdomain inventory.
📊 Result Summary
The Result section provides a compact overview of the enumeration result.
Example:
Result
niamonx.io
Subdomains: 4
22:49:02
Detailed summary:
Domain: niamonx.io
Subdomains: 4
Unique Areas: 1
Maximum Depth: 3
Typical fields include:
| Field | Description |
|---|---|
| Domain | The domain that was checked |
| Subdomains | Total number of discovered subdomains |
| Unique Areas | Number of unique main zones or grouped areas found in the result |
| Maximum Depth | Highest hostname depth found among discovered subdomains |
| Time | Time when the result was generated or displayed |
The summary is useful for quick reporting and comparing enumeration results across multiple domains or repeated audits.
📋 Subdomain Results Table
The Subdomain Results table displays discovered hostnames and calculated metadata.
Example table:
| # | Subdomain | Zone | Depth |
|---|---|---|---|
| 1 | dash.niamonx.io | niamonx.io | 3 |
| 2 | data-wells.niamonx.io | niamonx.io | 3 |
| 3 | poreva.niamonx.io | niamonx.io | 3 |
| 4 | support.niamonx.io | niamonx.io | 3 |
The table helps users quickly review discovered assets and understand their relationship to the main domain.
🌐 Subdomain Field
The Subdomain column shows the discovered hostname.
Example:
dash.niamonx.io
A subdomain may represent:
-
public website;
-
dashboard;
-
API endpoint;
-
support portal;
-
data service;
-
staging environment;
-
development environment;
-
mail-related host;
-
CDN endpoint;
-
customer portal;
-
documentation site;
-
third-party integration;
-
forgotten or legacy asset.
Subdomains are important because they often reveal additional public infrastructure that is not visible from the main website.
🧭 Zone Field
The Zone column shows the main domain or area associated with the discovered subdomain.
Example:
dash.niamonx.io → zone: niamonx.io
Another example:
api.dev.example.com → zone: example.com
The zone helps group discovered hostnames under their main domain.
This is useful when:
-
analyzing multiple related domains;
-
grouping results by root zone;
-
identifying which main domain a hostname belongs to;
-
preparing asset inventories;
-
filtering large subdomain lists;
-
separating results from different areas.
📏 Depth Field
The Depth column shows the number of levels in the hostname.
Example:
dash.niamonx.io → depth: 3
Explanation:
dash.niamonx.io
1: dash
2: niamonx
3: io
Depth: 3
Another example:
api.dev.example.com → zone: example.com, depth: 4
Explanation:
api.dev.example.com
1: api
2: dev
3: example
4: com
Depth: 4
Depth is useful for identifying deeply nested assets such as:
api.dev.example.com
login.internal.stage.example.com
cdn.assets.app.example.com
Deep hostnames may indicate development structures, environment separation, internal naming conventions, or complex infrastructure.
🔢 Unique Areas
The Unique Areas value shows how many unique zones or grouped domain areas are present in the result.
Example:
Unique Areas: 1
For a simple domain audit, this value is often 1, because all discovered subdomains belong to the same main domain.
This field becomes more useful when results include hostnames that may be grouped into different areas or zones.
Use cases:
-
grouping discovered assets;
-
identifying separate domain areas;
-
reviewing multi-zone results;
-
organizing large inventories;
-
understanding result diversity.
📈 Maximum Depth
The Maximum Depth value shows the deepest hostname level found in the result set.
Example:
Maximum Depth: 3
If the tool discovers a deeply nested hostname such as:
api.dev.example.com
the maximum depth would be:
4
Maximum Depth helps users identify whether the domain has only simple subdomains or more complex nested infrastructure.
Higher depth may indicate:
-
development environments;
-
segmented services;
-
nested application structure;
-
regional infrastructure;
-
customer-specific hostnames;
-
internal naming conventions;
-
legacy systems;
-
multi-level service organization.
🔎 Search and Filtering
The results table includes a search field for filtering discovered subdomains.
Example:
Search...
Search is useful when working with large result sets.
Users can search for terms such as:
api
dev
support
admin
stage
Search can help analysts quickly locate interesting or risky hostnames.
📄 Pagination
The table supports pagination for easier review of large result sets.
Example:
25 / page
Pagination helps users:
-
keep large results readable;
-
review results page by page;
-
avoid browser overload;
-
focus on smaller groups of hostnames;
-
manage large enumeration results.
For complete analysis, users should review all result pages.
🕓 History of Domains
Subdomains Check stores entered domains locally in the browser history.
Example interface section:
History of Domains
Filter...
History helps users:
-
repeat previous checks;
-
continue an investigation session;
-
quickly access recently analyzed domains;
-
filter prior domain inputs;
-
compare repeated checks over time.
Because the history is local, it may be removed when browser data is cleared or when the user changes devices, browsers, or profiles.
📤 Copy and Export Features
Subdomains Check supports several output actions for using results in reports or external tools.
Available actions may include:
-
Copy JSON
-
Copy list
-
Export to CSV
-
View Raw JSON
These features are useful for:
-
security reports;
-
SOC tickets;
-
incident response notes;
-
asset inventory systems;
-
bug bounty documentation;
-
compliance evidence;
-
attack surface management;
-
internal escalation;
-
further processing in scripts or tools.
📋 Copy List
The Copy list option allows users to copy discovered subdomains as a plain list.
Example output:
dash.niamonx.io
data-wells.niamonx.io
poreva.niamonx.io
support.niamonx.io
This is useful for:
-
pasting into notes;
-
feeding into DNS tools;
-
importing into scanners;
-
sharing with a team;
-
creating allowlists or monitoring lists;
-
adding assets to documentation.
🧬 Copy JSON and Raw JSON
The Copy JSON and Raw JSON options provide structured machine-readable data.
Raw JSON is useful for:
-
technical validation;
-
automation;
-
integration with external systems;
-
preserving the original response;
-
debugging;
-
audit trails;
-
further enrichment;
-
evidence storage.
JSON output may include:
domain
subdomains
zone
depth
total
unique_areas
maximum_depth
timestamp
When accuracy matters, users should preserve the Raw JSON together with the visible table result.
📄 Export to CSV
The Export to CSV option allows users to download the subdomain table in a spreadsheet-friendly format.
The CSV may include:
-
index;
-
subdomain;
-
zone;
-
depth.
Example CSV-style structure:
#,Subdomain,Zone,Depth
1,dash.niamonx.io,niamonx.io,3
2,data-wells.niamonx.io,niamonx.io,3
3,poreva.niamonx.io,niamonx.io,3
4,support.niamonx.io,niamonx.io,3
CSV export is useful for:
-
reporting;
-
asset inventory;
-
spreadsheet review;
-
compliance records;
-
security audit evidence;
-
comparing results over time;
-
sharing findings with non-technical teams.
🔐 Why Subdomain Enumeration Matters
Subdomains are a critical part of an organization’s public attack surface. A company may secure its main website while leaving older, forgotten, or poorly maintained subdomains exposed.
Subdomain enumeration helps identify:
-
public applications;
-
admin panels;
-
dashboards;
-
APIs;
-
development environments;
-
staging systems;
-
support portals;
-
legacy services;
-
forgotten assets;
-
cloud-hosted systems;
-
third-party integrations;
-
takeover-prone records;
-
exposed documentation;
-
unexpected public endpoints.
A complete subdomain inventory is often the first step in attack surface management and external security review.
🔎 Common Use Cases
Attack Surface Mapping
Build a list of known public subdomains for a domain and use it as the foundation for further DNS, HTTP, TLS, and security analysis.
OSINT Research
Discover publicly known hostnames connected to an organization, product, brand, or domain.
SOC Triage
Check whether a suspicious hostname belongs to a known domain and determine whether it should be investigated further.
Incident Response
Brand Protection
Find suspicious or unexpected subdomains that may be relevant to impersonation, phishing, fraud, or unauthorized use of brand infrastructure.
Bug Bounty Reconnaissance
Collect in-scope hostnames for authorized security testing and further technical validation.
Asset Inventory
Create or update an inventory of public-facing hostnames associated with an organization.
Compliance Review
Document known public subdomains as part of security audits, risk reviews, or infrastructure governance.
Shadow IT Detection
Identify hostnames that may belong to undocumented systems, old projects, unmanaged services, or unknown teams.
Follow-Up DNS Analysis
Use the discovered list as input for tools that resolve IPv4, IPv6, CNAME, MX, TXT, NS, HTTP, TLS, or screenshot data.
🧠 Recommended Workflow
A practical Subdomains Check workflow should follow these steps.
1. Enter the Domain
Use only the domain name without protocol.
Example:
niamonx.io
Do not enter:
https://niamonx.io
2. Run the Enumeration
Start the search and wait for the result.
Example:
Search and Check Subdomains
The system will enumerate subdomains through internal services and archives.
3. Review the Result Summary
Check the domain, total number of subdomains, unique areas, maximum depth, and timestamp.
Example:
Domain: niamonx.io
Subdomains: 4
Unique Areas: 1
Maximum Depth: 3
4. Review the Subdomain Table
Inspect every discovered hostname.
Example:
dash.niamonx.io
data-wells.niamonx.io
poreva.niamonx.io
support.niamonx.io
Look for unusual names, old systems, staging environments, administrative portals, and unexpected assets.
5. Use Search for Interesting Keywords
Search for common high-risk terms.
Examples:
admin
dev
test
stage
backup
internal
These terms may indicate systems that require closer review.
6. Review Zone and Depth
Use the Zone and Depth fields to understand hostname structure.
Example:
api.dev.example.com → zone: example.com, depth: 4
Deep subdomains may reveal application structure, environment naming, or internal service organization.
7. Export the Results
Use copy or export actions to preserve the data.
Recommended exports:
Copy list
Copy JSON
Export to CSV
Raw JSON
8. Enrich the Subdomain List
After enumeration, enrich the discovered list with additional tools.
Recommended follow-up checks:
-
DNS A and AAAA records;
-
CNAME records;
-
MX, TXT, and NS records;
-
HTTP status codes;
-
screenshots;
-
TLS certificates;
-
IP WHOIS;
-
ASN information;
-
technology fingerprints;
-
historical DNS;
-
vulnerability scanning, when authorized.
9. Compare With Official Asset Inventory
Compare discovered subdomains with the organization’s known asset list.
Questions to ask:
-
Is this subdomain expected?
-
Who owns it?
-
Is it documented?
-
Is it still active?
-
Is it monitored?
-
Is it protected by the same security controls?
-
Does it expose sensitive functionality?
-
Should it be removed or consolidated?
🚨 Security Review Checklist
When reviewing subdomain enumeration results, pay special attention to suspicious or high-risk patterns.
Administrative Interfaces
Look for hostnames such as:
admin.example.com
dashboard.example.com
panel.example.com
portal.example.com
login.example.com
These may expose authentication portals or administrative systems.
Development and Testing Environments
Look for names such as:
dev.example.com
test.example.com
stage.example.com
staging.example.com
qa.example.com
uat.example.com
demo.example.com
These systems may have weaker security controls than production environments.
Legacy or Forgotten Assets
Look for names such as:
old.example.com
legacy.example.com
backup.example.com
archive.example.com
temp.example.com
Legacy assets may contain outdated software, expired certificates, weak authentication, or forgotten services.
Internal-Looking Names
Look for hostnames such as:
internal.example.com
intranet.example.com
vpn.example.com
private.example.com
corp.example.com
Even if the name suggests internal use, the hostname may still be publicly discoverable and should be reviewed.
API and Data Services
Look for names such as:
api.example.com
data.example.com
graphql.example.com
db.example.com
storage.example.com
files.example.com
These may expose backend services, APIs, file storage, or data-related endpoints.
Customer or Tenant Subdomains
Look for patterns such as:
customer1.example.com
client.example.com
tenant.example.com
org.example.com
Tenant-based subdomains may require special handling, access controls, and monitoring.
📊 Interpreting Results Correctly
Subdomain enumeration results should be interpreted carefully.
Important notes:
-
A discovered subdomain does not automatically mean the service is active.
-
A discovered subdomain does not automatically mean a vulnerability exists.
-
Some hostnames may be historical or archived.
-
Some subdomains may no longer resolve in DNS.
-
Some subdomains may be protected by access controls.
-
Internal services may still have public DNS names.
-
Results can change over time.
-
Discovery sources may not be complete.
-
Enumeration may miss newly created or private subdomains.
-
Hostname depth does not indicate risk by itself.
-
Zone grouping helps organization but does not prove ownership.
-
Further validation is required before making security conclusions.
Subdomains Check provides a discovery layer. For deeper investigation, combine results with DNS resolution, HTTP checks, TLS inspection, screenshots, IP WHOIS, ASN data, and authorized security testing.
🧾 Recommended Reporting Format
When documenting results, use a consistent structure.
Example:
Domain: niamonx.io
Enumeration time: 22:49:02
Total subdomains: 4
Unique areas: 1
Maximum depth: 3

Discovered subdomains:
1. dash.niamonx.io | Zone: niamonx.io | Depth: 3
2. data-wells.niamonx.io | Zone: niamonx.io | Depth: 3
3. poreva.niamonx.io | Zone: niamonx.io | Depth: 3
4. support.niamonx.io | Zone: niamonx.io | Depth: 3
For security reports, add analyst notes:
Observation:
The domain has 4 discovered subdomains. All discovered hostnames belong to the zone niamonx.io and have depth 3.

Recommended next step:
Resolve DNS records, check HTTP availability, review TLS certificates, capture screenshots, and compare the results against the official asset inventory.
🛡️ Security, Privacy & Responsible Use
Subdomains Check is intended for lawful domain analysis, OSINT research, security review, asset inventory, compliance, and defensive cybersecurity workflows.
Acceptable use cases include:
-
auditing domains you own or are authorized to review;
-
mapping public attack surface;
-
discovering known public hostnames;
-
supporting incident response;
-
enriching SOC investigations;
-
reviewing brand-related infrastructure;
-
preparing asset inventories;
-
checking for forgotten subdomains;
-
documenting public exposure;
-
supporting authorized bug bounty reconnaissance.
Users should follow responsible use principles:
-
Do not use the tool for unauthorized targeting or harassment.
-
Do not attempt to exploit discovered services.
-
Do not assume that discovery equals vulnerability.
-
Validate findings responsibly.
-
Follow authorization boundaries.
-
Store exported results securely.
-
Avoid sharing sensitive investigation results publicly.
-
Report security issues through proper disclosure channels.
Subdomain enumeration is a normal defensive and OSINT technique, but it should be used responsibly and legally.
⚙️ Technical Highlights
-
Subdomain enumeration tool
-
Available at
dash.niamonx.io/subdomains_check -
Searches and checks subdomains for a target domain
-
Uses internal services and archives
-
Accepts domains without protocol
-
Validates domain input
-
Shows total number of discovered subdomains
-
Shows unique areas
-
Shows maximum depth
-
Displays timestamped results
-
Provides searchable result table
-
Supports pagination
-
Calculates zone for each subdomain
-
Calculates depth for each subdomain
-
Maintains local domain history
-
Supports filtering domain history
-
Allows copying JSON
-
Allows copying subdomain list
-
Supports CSV export
-
Provides Raw JSON view
-
Suitable for OSINT, SOC, incident response, attack surface mapping, compliance, brand protection, and infrastructure inventory
📌 Usage Hints
-
Enter only the domain, such as
example.com. -
Do not include
https://orhttp://. -
Do not include paths, query strings, fragments, or wildcards.
-
Use the result summary for quick triage.
-
Review total subdomain count.
-
Check Unique Areas to understand grouping.
-
Check Maximum Depth to identify nested hostnames.
-
Use the search field to find interesting names.
-
Review all pages when the result set is large.
-
Copy the list for quick use in other tools.
-
Export CSV for reporting or spreadsheet review.
-
Use Raw JSON for technical validation and automation.
-
Compare discovered hostnames with the official asset inventory.
-
Enrich results with DNS, HTTP, TLS, screenshot, WHOIS, and ASN tools.
-
Repeat checks over time because subdomain exposure changes.
-
Clear local history on shared devices when analyzing sensitive domains.
-
Use results only within legal and authorized boundaries.
📬 Contact Information
For technical, legal, abuse, privacy, or support-related inquiries, users can contact the NiamonX team directly:
support@niamonx.io — Technical Support
other@niamonx.io — General Inquiries
takedown@niamonx.io — Privacy or Data Removal Requests
legal@niamonx.io — Legal and Compliance Matters
Alternative contact channel:
🔗 Helpdesk: https://support.niamonx.io/
Summary
NiamonX Subdomains Check is a focused subdomain enumeration tool for discovering and organizing subdomains of a target domain. It validates domain input, searches internal services and archives, displays discovered subdomains, calculates zone and depth, shows total count, unique areas, maximum depth, and provides search, pagination, local history, copy options, CSV export, and Raw JSON view.
The tool is designed for OSINT research, attack surface mapping, SOC triage, incident response, brand protection, compliance documentation, asset inventory, and authorized security workflows. Results should be treated as point-in-time discovery intelligence and enriched with DNS resolution, HTTP checks, TLS data, screenshots, IP WHOIS, ASN information, and official asset inventory validation before drawing security conclusions.
Subdomains Check V2 | Experimental Subdomain & DNS Records Discovery Tool
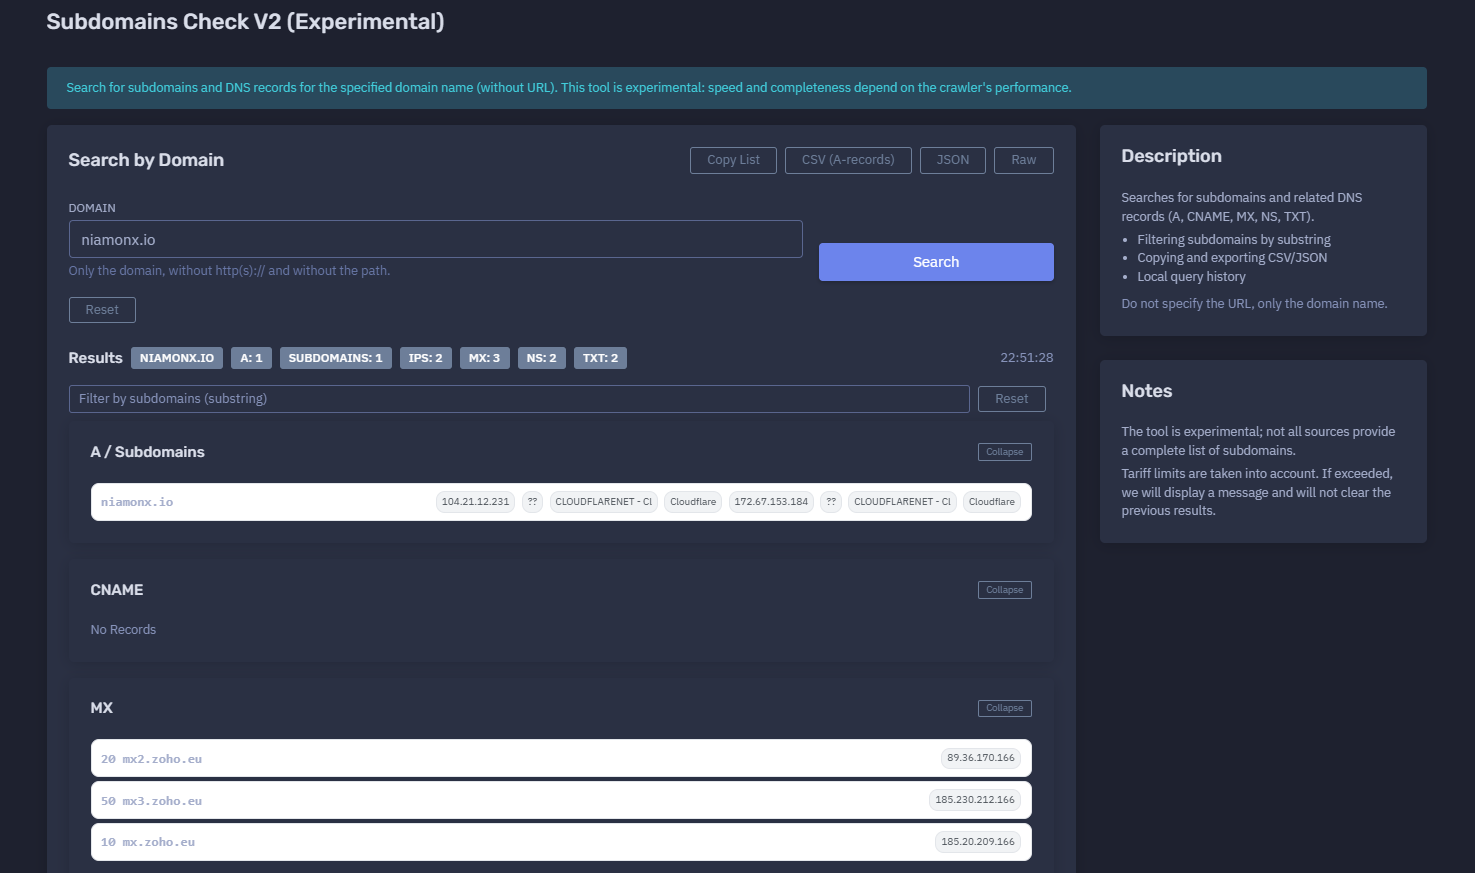
The platform available at https://dash.niamonx.io/subdomains_v2 — known as Subdomains Check V2 — is an experimental domain intelligence tool within the NiamonX platform. It searches for subdomains and related DNS records for a specified domain name, including A records, CNAME records, MX records, NS records, TXT records, resolved IP addresses, and basic network/provider information.
This tool is designed for fast domain reconnaissance, DNS inventory, infrastructure mapping, attack surface review, OSINT analysis, SOC workflows, incident response, and technical asset discovery.
Because the module is experimental, the speed, coverage, and completeness of results may depend on crawler performance, available sources, DNS response behavior, and tariff limits.
Overview of the Service
Subdomains Check V2 helps users discover subdomains and associated DNS records for a target domain. The tool accepts a domain name, performs discovery and DNS resolution, then organizes the results into clear sections.
The module can return:
-
A records
-
Discovered subdomains
-
Resolved IP addresses
-
CNAME records
-
MX records
-
NS records
-
TXT records
-
Basic IP/network provider information
-
Local request history
-
Exportable CSV and JSON data
Subdomains Check V2 is useful when users need to quickly understand which public DNS records and subdomains are associated with a domain.
The tool is especially helpful for:
-
OSINT analysts
-
SOC teams
-
Incident response teams
-
Threat intelligence researchers
-
Attack surface management teams
-
Bug bounty researchers
-
DNS administrators
-
DevOps engineers
-
Security auditors
-
Brand protection teams
-
Compliance teams
-
Infrastructure owners
🔍 How the Tool Works
When a user enters a domain name, Subdomains Check V2 searches for subdomains and related DNS records. The tool then resolves available records and presents the results in grouped sections.
Example input:
Domain: niamonx.io
Example result summary:
niamonx.io
A: 1
Subdomains: 1
IPs: 2
MX: 3
NS: 2
TXT: 2
22:51:28
Example resolved A / subdomain result:
niamonx.io
104.21.12.231
CLOUDFLARENET
Cloudflare

172.67.153.184
CLOUDFLARENET
Cloudflare
Example DNS records:
MX:
20 mx2.zoho.eu
50 mx3.zoho.eu
10 mx.zoho.eu

NS:
abdullah.ns.cloudflare.com
ashley.ns.cloudflare.com

TXT:
"google-site-verification=MQNH6Yoh9hKD1hgzeQtEb9VN5_ikdspHYQxlxGS6Y-4"
"v=spf1 include:zohomail.eu -all"
The tool provides a practical overview of both discovered subdomains and domain-level DNS configuration.
🧩 Supported Input
Subdomains Check V2 accepts only a domain name.
Correct input examples:
niamonx.io
example.com
sub.example.com
company.org
Incorrect input examples:
https://niamonx.io
http://example.com
https://example.com/page
example.com/path
*.example.com
user@example.com
192.168.1.1
localhost
The interface guidance is:
Only the domain, without http(s):// and without the path.
Users should enter the domain only, without protocol, path, query parameters, fragments, wildcard prefixes, or URL formatting.
Recommended input format:
domain.tld
⚙️ Main Function: Search by Domain
The main search field starts the domain discovery and DNS record collection process.
Example:
Search by Domain
Domain: niamonx.io
After the query is processed, the tool displays a result summary and grouped DNS sections.
The tool may collect and display:
-
root domain A records;
-
discovered subdomains;
-
resolved IP addresses;
-
CNAME records;
-
MX records;
-
NS records;
-
TXT records;
-
IP ownership/provider hints;
-
local request history.
Because this version is experimental, results may vary depending on crawler performance and available data sources.
🧪 Experimental Status
Subdomains Check V2 is marked as experimental.
Interface note:
This tool is experimental: speed and completeness depend on the crawler's performance.
This means:
-
not all sources may return complete data;
-
some subdomains may be missed;
-
some records may be temporarily unavailable;
-
crawler speed may vary;
-
large domains may take longer;
-
results may differ between repeated checks;
-
DNS changes may affect output;
-
tariff limits may affect whether a new query can be completed.
The tool should be treated as a fast discovery and enrichment layer, not as a guaranteed complete DNS inventory.
For critical security work, results should be validated with additional tools and repeated over time.
📊 Results Summary
The Results section provides a compact overview of the discovered records.
Example:
niamonx.io
A: 1
Subdomains: 1
IPs: 2
MX: 3
NS: 2
TXT: 2
22:51:28
Typical fields include:
| Field | Description |
|---|---|
| Domain | The domain that was searched |
| A | Number of A-record hostnames or A-record groups found |
| Subdomains | Number of discovered subdomain entries |
| IPs | Number of resolved IP addresses |
| MX | Number of mail exchanger records |
| NS | Number of name server records |
| TXT | Number of text records |
| Time | Query time or result timestamp |
The summary is useful for quick triage and comparison between multiple domain checks.
🌐 A Records and Subdomains Section
The A / Subdomains section shows hostnames and their resolved IPv4 addresses.
Example:
A / Subdomains

niamonx.io
104.21.12.231
CLOUDFLARENET
Cloudflare

172.67.153.184
CLOUDFLARENET
Cloudflare
A records are used to map hostnames to IPv4 addresses.
This section helps users identify:
-
public-facing hosts;
-
CDN-backed services;
-
cloud-hosted infrastructure;
-
shared hosting or provider networks;
-
exposed root-domain records;
-
resolved subdomain infrastructure;
-
IPs that should be enriched with WHOIS or ASN data.
A single hostname may resolve to multiple IP addresses because of:
-
CDN usage;
-
load balancing;
-
high availability;
-
geo-distributed infrastructure;
-
provider-managed routing;
-
DNS round-robin behavior.
🏢 Network and Provider Information
Subdomains Check V2 may show basic provider or network hints next to resolved IP addresses.
Example:
CLOUDFLARENET - Cl
Cloudflare
This helps users quickly identify whether a hostname appears to be associated with:
-
CDN providers;
-
cloud providers;
-
hosting companies;
-
ISP infrastructure;
-
security proxy services;
-
managed DNS or edge networks.
Provider information is useful for triage, but it should not be treated as final attribution. For accurate infrastructure ownership analysis, users should also check IP WHOIS, ASN data, BGP routes, passive DNS, HTTP headers, and TLS certificates.
🔎 Filtering by Subdomains
The tool provides filtering by subdomain substring.
Example:
Filter by subdomains (substring)
Filtering is useful when working with large result sets.
Users can search for terms such as:
api
admin
dev
stage
support
mail
This helps analysts quickly locate interesting, risky, or business-relevant hostnames.
🔁 CNAME Records
The CNAME section displays canonical name records.
Example:
CNAME
No Records
A CNAME record points one hostname to another canonical hostname.
Example:
app.example.com → example.hosting-provider.com
CNAME records are useful for identifying:
-
third-party services;
-
cloud applications;
-
SaaS integrations;
-
CDN aliases;
-
managed landing pages;
-
verification targets;
-
external dependencies;
-
possible subdomain takeover risks.
If the tool shows:
No Records
it means no CNAME records were returned for the current result set.
Important security note: CNAME records pointing to third-party services should be reviewed carefully. Abandoned or misconfigured CNAME records may indicate potential subdomain takeover risk, but this must be validated responsibly.
📬 MX Records
The MX section shows mail exchanger records for the domain.
Example:
MX
20 mx2.zoho.eu
50 mx3.zoho.eu
10 mx.zoho.eu
MX records define where e-mail for the domain should be delivered.
The number before the mail server is the MX priority.
Example:
10 mx.zoho.eu
Lower priority numbers are preferred first.
In the example above:
10 mx.zoho.eu
20 mx2.zoho.eu
50 mx3.zoho.eu
the mail server with priority 10 is preferred before 20 and 50.
MX records are useful for:
-
identifying mail providers;
-
reviewing e-mail infrastructure;
-
checking business mail routing;
-
validating domain configuration;
-
supporting phishing and spoofing investigations;
-
preparing e-mail security reviews.
🌍 MX IP Resolution
Subdomains Check V2 may also resolve MX hostnames to IP addresses.
Example:
20 mx2.zoho.eu
89.36.170.166

50 mx3.zoho.eu
185.230.212.166

10 mx.zoho.eu
185.20.209.166
This helps users understand not only which mail servers are configured, but also which IP addresses they resolve to.
MX IP resolution is useful for:
-
mail infrastructure mapping;
-
provider verification;
-
allowlist planning;
-
e-mail security review;
-
incident response;
-
troubleshooting mail delivery;
-
comparing DNS results across time.
🧭 NS Records
The NS section shows authoritative name servers for the domain.
Example:
NS
abdullah.ns.cloudflare.com
162.159.44.203

ashley.ns.cloudflare.com
172.64.32.71
NS records indicate which name servers are responsible for the domain’s DNS zone.
Name server data helps identify:
The tool may also resolve name server hostnames to IP addresses.
Example:
abdullah.ns.cloudflare.com → 162.159.44.203
ashley.ns.cloudflare.com → 172.64.32.71
NS records are important during security audits because DNS provider compromise or misconfiguration can affect the entire domain.
🧾 TXT Records
The TXT section displays text records associated with the domain.
Example:
TXT
"google-site-verification=MQNH6Yoh9hKD1hgzeQtEb9VN5_ikdspHYQxlxGS6Y-4"
"v=spf1 include:zohomail.eu -all"
TXT records may contain:
-
SPF policies;
-
DMARC records;
-
DKIM records;
-
domain ownership verification tokens;
-
third-party service verification;
-
security policy metadata;
-
mail provider configuration;
-
platform integration records.
TXT records are useful for identifying how a domain is connected to external services and how e-mail authentication is configured.
📧 SPF Records
TXT records may include SPF configuration.
Example:
v=spf1 include:zohomail.eu -all
SPF defines which mail servers are allowed to send e-mail on behalf of the domain.
In this example:
include:zohomail.eu
allows Zoho Mail infrastructure to send mail for the domain.
The ending:
-all
means mail from unauthorized senders should fail SPF validation.
SPF records are important for:
-
preventing spoofing;
-
e-mail authentication;
-
phishing resistance;
-
mail delivery reliability;
-
domain security posture.
🔐 Domain Verification Records
TXT records may also include verification tokens.
Example:
google-site-verification=MQNH6Yoh9hKD1hgzeQtEb9VN5_ikdspHYQxlxGS6Y-4
Verification records are commonly used by services such as:
-
Google;
-
Microsoft;
-
Zoho;
-
cloud providers;
-
SaaS platforms;
-
CDN services;
-
mail providers;
-
analytics platforms;
-
search console tools.
These records prove domain ownership to third-party services.
Security teams should review TXT records to identify outdated, unused, or unexpected third-party integrations.
🕓 Local Request History
Subdomains Check V2 stores a local request history in the browser.
Example interface note:
Request history (local)
Filter...
We keep the domain and a brief summary (up to 200 entries).
Example history item:
niamonx.io
A:1
Subs:1
IPs:2
17.06.2026, 22:51:28
Other examples:
itstep.org
A:50
Subs:50
IPs:2
16.05.2026, 22:37:48
haveibeenpwned.com
A:13
Subs:13
IPs:3
10.12.2025, 00:46:07
The local history helps users:
-
repeat previous checks;
-
compare domain summaries over time;
-
continue investigation sessions;
-
filter previous requests;
-
quickly revisit recently analyzed domains.
Because history is stored locally in the browser, it may be removed when browser data is cleared or when the user changes browser profiles, devices, or private browsing sessions.
🚦 Tariff Limits
Subdomains Check V2 respects user tariff limits.
Interface note:
Tariff limits are taken into account. If exceeded, we will display a message and will not clear the previous results.
Important points:
-
Each query may consume plan quota.
-
Limits depend on the user’s active plan.
-
Large or repeated searches may reach the limit faster.
-
If the limit is exceeded, the tool displays a warning.
-
Previous results remain visible when the limit is exceeded.
-
The interface does not clear previous results after a limit error.
This behavior helps prevent users from losing their last successful result when a new query cannot be completed.
📤 Copying and Exporting Results
Subdomains Check V2 supports copying and exporting data.
Available actions may include:
-
copy results;
-
export CSV;
-
export JSON;
-
copy DNS records;
-
preserve local history summaries.
Export features are useful for:
-
security reports;
-
SOC tickets;
-
incident response notes;
-
compliance evidence;
-
asset inventory;
-
attack surface documentation;
-
spreadsheet analysis;
-
automation workflows;
-
historical comparison.
📄 CSV Export
CSV export allows users to work with results in spreadsheet tools or reporting systems.
CSV data may include:
-
domain;
-
hostname;
-
record type;
-
record value;
-
resolved IP;
-
provider information;
-
priority for MX records;
-
timestamp.
Example CSV-style structure:
Domain,Record Type,Hostname,Value,IP,Provider
niamonx.io,A,niamonx.io,104.21.12.231,104.21.12.231,Cloudflare
niamonx.io,A,niamonx.io,172.67.153.184,172.67.153.184,Cloudflare
niamonx.io,MX,niamonx.io,10 mx.zoho.eu,185.20.209.166,Zoho
niamonx.io,NS,niamonx.io,abdullah.ns.cloudflare.com,162.159.44.203,Cloudflare
niamonx.io,TXT,niamonx.io,"v=spf1 include:zohomail.eu -all",,
CSV export is useful when results need to be shared with technical teams, compliance departments, management, or auditors.
🧬 JSON Export
JSON export provides structured machine-readable output.
JSON data may include:
-
searched domain;
-
A records;
-
subdomains;
-
IP addresses;
-
CNAME records;
-
MX records;
-
NS records;
-
TXT records;
-
resolved IP details;
-
timestamp;
-
summary counts.
JSON is useful for:
-
automation;
-
API-style processing;
-
custom scripts;
-
evidence preservation;
-
technical validation;
-
integration with asset inventory systems;
-
comparing results over time.
🔐 Why This Tool Matters
Subdomains and DNS records are a major part of an organization’s public attack surface. A domain may appear simple from the outside, but DNS records can reveal mail providers, name servers, cloud services, CDN usage, verification tokens, third-party dependencies, and public application endpoints.
Subdomains Check V2 helps users identify:
-
public hostnames;
-
exposed services;
-
CDN-backed infrastructure;
-
mail infrastructure;
-
DNS providers;
-
TXT-based service integrations;
-
SPF configuration;
-
name server dependencies;
-
resolved IP addresses;
-
possible third-party exposure;
-
unexpected or forgotten records.
This information supports both defensive security and operational infrastructure management.
🔎 Common Use Cases
DNS Inventory
Create a structured overview of DNS records associated with a domain.
Subdomain Discovery
Find discovered subdomains and review how they resolve.
Attack Surface Mapping
Identify public hostnames, IP addresses, DNS providers, and mail systems.
SOC Triage
Enrich alerts involving domains, hostnames, or suspicious DNS records.
Incident Response
Check whether a suspicious domain or subdomain is related to known infrastructure.
Phishing Investigation
Review DNS records, mail configuration, and provider information for suspicious domains.
Brand Protection
Inspect domains and subdomains related to impersonation, fraud, or unauthorized brand usage.
Mail Security Review
Review MX and TXT records, including SPF-related configuration.
DNS Provider Review
Check NS records and identify authoritative DNS providers.
Cloud and CDN Mapping
Identify whether hostnames resolve to CDN or cloud provider infrastructure.
Compliance Documentation
Document DNS records and public exposure for audits, reports, and risk reviews.
Asset Inventory
Add discovered hostnames, IPs, and records to an asset management workflow.
🧠 Recommended Workflow
A practical Subdomains Check V2 workflow should follow these steps.
1. Enter the Domain
Use only the domain name.
Example:
niamonx.io
Do not include:
https://
http://
/path
?query=value
#fragment
*
2. Run the Search
Start the query and wait for the result.
Example:
Search by Domain
The tool will search for subdomains and related DNS records.
3. Review the Summary
Check the high-level result counts.
Example:
A: 1
Subdomains: 1
IPs: 2
MX: 3
NS: 2
TXT: 2
This gives a quick overview of how much data was found.
4. Review A / Subdomains
Inspect discovered hostnames and IP addresses.
Example:
niamonx.io
104.21.12.231
172.67.153.184
Follow up with IP WHOIS, ASN lookup, HTTP checks, TLS inspection, or screenshot capture when needed.
5. Check CNAME Records
Review whether the domain or subdomains point to external services.
Example:
CNAME: No Records
If CNAME records exist, validate whether the targets are expected and still active.
6. Review MX Records
Check mail routing and provider configuration.
Example:
10 mx.zoho.eu
20 mx2.zoho.eu
50 mx3.zoho.eu
Confirm that the mail provider is expected and that MX priorities are correct.
7. Review NS Records
Example:
abdullah.ns.cloudflare.com
ashley.ns.cloudflare.com
Verify that the DNS provider is expected and properly managed.
8. Review TXT Records
Inspect TXT records for SPF, verification tokens, and third-party integrations.
Example:
v=spf1 include:zohomail.eu -all
Check for outdated, unexpected, or overly permissive records.
9. Filter Subdomains
Use substring filtering to locate interesting names.
Examples:
api
admin
dev
stage
mail
support
Filtering is useful for large domains with many discovered subdomains.
10. Export Results
Use CSV or JSON export for reporting and follow-up analysis.
Recommended exports:
CSV
JSON
11. Validate With Additional Tools
Because the tool is experimental, validate important findings with additional sources.
Recommended follow-up checks:
-
DNS resolver checks;
-
Subdomains Extended;
-
IP WHOIS;
-
ASN lookup;
-
HTTP status checks;
-
TLS certificate inspection;
-
website screenshot capture;
-
passive DNS;
-
historical DNS;
-
technology fingerprinting;
-
authorized vulnerability scanning.
🚨 Security Review Checklist
When reviewing results, pay special attention to the following areas.
Unexpected IP Addresses
Check whether resolved IPs belong to expected providers.
Questions:
-
Is this IP expected?
-
Does it belong to the correct provider?
-
Is it shared CDN infrastructure?
-
Is it an origin server?
-
Should this hostname be publicly exposed?
Third-Party Dependencies
Review CNAME, NS, MX, and TXT records for third-party services.
Potential dependencies:
-
CDN providers;
-
DNS providers;
-
mail providers;
-
SaaS platforms;
-
cloud hosting services;
-
verification platforms;
-
analytics or marketing tools.
Mail Security
Review MX and TXT records.
Important checks:
-
Is the mail provider expected?
-
Does SPF exist?
-
Is SPF too broad?
-
Is DMARC present in related records?
-
Are DKIM records configured elsewhere?
-
Are old verification records still needed?
Name Server Control
Review NS records.
Questions:
-
Are the name servers expected?
-
Who controls the DNS provider account?
-
Is MFA enabled on the DNS provider?
-
Are there stale delegations?
-
Is DNS change monitoring enabled?
Subdomain Exposure
Review discovered subdomains and search for sensitive patterns.
Examples:
admin
dev
test
stage
staging
internal
portal
dashboard
api
backup
old
legacy
These names may indicate systems that need closer review.
TXT Record Hygiene
TXT records can expose operational information.
Review for:
-
outdated verification tokens;
-
unused provider integrations;
-
old SPF includes;
-
sensitive metadata;
-
abandoned service records;
-
unclear ownership.
⚠️ Limitations and Important Notes
Subdomains Check V2 should be interpreted carefully.
Important limitations:
-
The tool is experimental.
-
Results may not be complete.
-
Crawler performance affects speed and coverage.
-
Some sources may not provide all subdomains.
-
DNS records may change frequently.
-
Some records may be cached.
-
Some subdomains may not resolve.
-
Provider information may be approximate.
-
A record count does not necessarily mean the number of active applications.
-
CDN IPs may be shared by many unrelated customers.
-
Missing CNAME records do not prove there are no external dependencies.
-
Missing TXT records do not prove that no verification records exist elsewhere.
-
Tariff limits may prevent new queries.
-
If tariff limits are exceeded, previous results remain visible.
Interface note:
The tool is experimental; not all sources provide a complete list of subdomains.
For high-confidence analysis, combine results with multiple discovery and DNS validation methods.
📊 Interpreting Results Correctly
Subdomains Check V2 provides point-in-time DNS and subdomain intelligence.
Important interpretation notes:
-
A discovered hostname does not automatically indicate risk.
-
A missing record does not always prove absence.
-
DNS data can vary by resolver, region, cache, and time.
-
CDN and cloud records may hide origin infrastructure.
-
Mail records show routing, not necessarily account ownership.
-
TXT records may represent active or historical integrations.
-
NS records show authoritative DNS providers, but not full security posture.
-
IP provider names help with triage but should be validated.
-
Experimental discovery may miss subdomains.
-
Repeated checks over time may produce different results.
The tool should be used as part of a broader investigation workflow.
🧾 Recommended Reporting Format
When documenting results, use a consistent format.
Example:
Domain: niamonx.io
Query time: 17.06.2026, 22:51:28

Summary:
A records: 1
Subdomains: 1
Resolved IPs: 2
MX records: 3
NS records: 2
TXT records: 2

A / Subdomains:
niamonx.io
- 104.21.12.231
- 172.67.153.184

MX:
- 10 mx.zoho.eu → 185.20.209.166
- 20 mx2.zoho.eu → 89.36.170.166
- 50 mx3.zoho.eu → 185.230.212.166

NS:
- abdullah.ns.cloudflare.com → 162.159.44.203
- ashley.ns.cloudflare.com → 172.64.32.71

TXT:
- "google-site-verification=MQNH6Yoh9hKD1hgzeQtEb9VN5_ikdspHYQxlxGS6Y-4"
- "v=spf1 include:zohomail.eu -all"
For security reports, add analyst notes:
Observation:
The domain resolves through Cloudflare infrastructure and uses Zoho mail exchangers. TXT records include Google site verification and SPF authorization for Zoho Mail.

Recommended next step:
Validate DMARC and DKIM configuration, confirm that the listed providers are expected, review DNS provider account security, and enrich resolved IPs with WHOIS / ASN data.
🛡️ Security, Privacy & Responsible Use
Subdomains Check V2 is intended for lawful DNS analysis, OSINT research, security review, compliance, infrastructure mapping, and defensive cybersecurity workflows.
Acceptable use cases include:
-
auditing domains you own or are authorized to assess;
-
reviewing public DNS configuration;
-
discovering subdomains;
-
mapping public infrastructure;
-
supporting incident response;
-
enriching SOC investigations;
-
reviewing mail and DNS security;
-
checking provider dependencies;
-
documenting public exposure;
-
preparing asset inventories;
-
supporting authorized bug bounty reconnaissance.
Users should follow responsible use principles:
-
Do not use the tool for unauthorized targeting or harassment.
-
Do not attempt to exploit discovered systems.
-
Do not assume that DNS discovery equals vulnerability.
-
Validate important findings with additional evidence.
-
Follow authorization boundaries.
-
Store exported results securely.
-
Avoid exposing sensitive investigation results publicly.
-
Report issues through proper disclosure channels.
Subdomain and DNS discovery is a legitimate defensive and OSINT technique, but it should be used responsibly and legally.
⚙️ Technical Highlights
-
Experimental subdomain and DNS discovery tool
-
Available at
dash.niamonx.io/subdomains_v2 -
Searches by domain name
-
Accepts domains without protocol or path
-
Searches for subdomains
-
Collects A records
-
Collects CNAME records
-
Collects MX records
-
Collects NS records
-
Collects TXT records
-
Resolves IP addresses
-
Shows basic provider/network hints
-
Displays result summary counts
-
Supports filtering by subdomain substring
-
Supports copying results
-
Supports CSV export
-
Supports JSON export
-
Maintains local request history
-
Stores up to 200 local history entries
-
Preserves previous results if tariff limit is exceeded
-
Suitable for OSINT, SOC, incident response, attack surface management, DNS review, mail security analysis, and infrastructure mapping
📌 Usage Hints
-
Enter only the domain name, such as
example.com. -
Do not include
http://orhttps://. -
Do not include paths, query strings, fragments, or wildcards.
-
Review the summary counts first.
-
Check A records and resolved IPs.
-
Review provider hints, but validate them with IP WHOIS and ASN tools.
-
Use subdomain filtering to find interesting names.
-
Check CNAME records for third-party dependencies.
-
Review MX records to understand mail routing.
-
Review NS records to confirm DNS provider configuration.
-
Review TXT records for SPF and verification tokens.
-
Export CSV for reporting and spreadsheet review.
-
Export JSON for automation and technical validation.
-
Repeat checks over time because DNS data changes.
-
Treat results as experimental and validate important findings.
-
Keep local history in mind when using shared devices.
-
Use the tool only within authorized and lawful workflows.
📬 Contact Information
For technical, legal, abuse, privacy, or support-related inquiries, users can contact the NiamonX team directly:
support@niamonx.io — Technical Support
other@niamonx.io — General Inquiries
takedown@niamonx.io — Privacy or Data Removal Requests
legal@niamonx.io — Legal and Compliance Matters
Alternative contact channel:
🔗 Helpdesk: https://support.niamonx.io/
Summary
NiamonX Subdomains Check V2 is an experimental subdomain and DNS records discovery tool for domain-based reconnaissance. It searches for subdomains and related DNS records, including A, CNAME, MX, NS, and TXT records, resolves IP addresses, shows basic provider information, supports substring filtering, provides CSV and JSON export, and stores local request history with brief summaries.
The tool is designed for OSINT research, DNS inventory, SOC workflows, incident response, attack surface mapping, mail security review, provider dependency analysis, brand protection, compliance documentation, and authorized security assessments. Because it is experimental, results should be treated as point-in-time discovery intelligence and validated with additional DNS, WHOIS, ASN, HTTP, TLS, screenshot, passive DNS, and asset inventory sources before drawing final conclusions.
URL Shortener | Custom Short Link Creation Tool
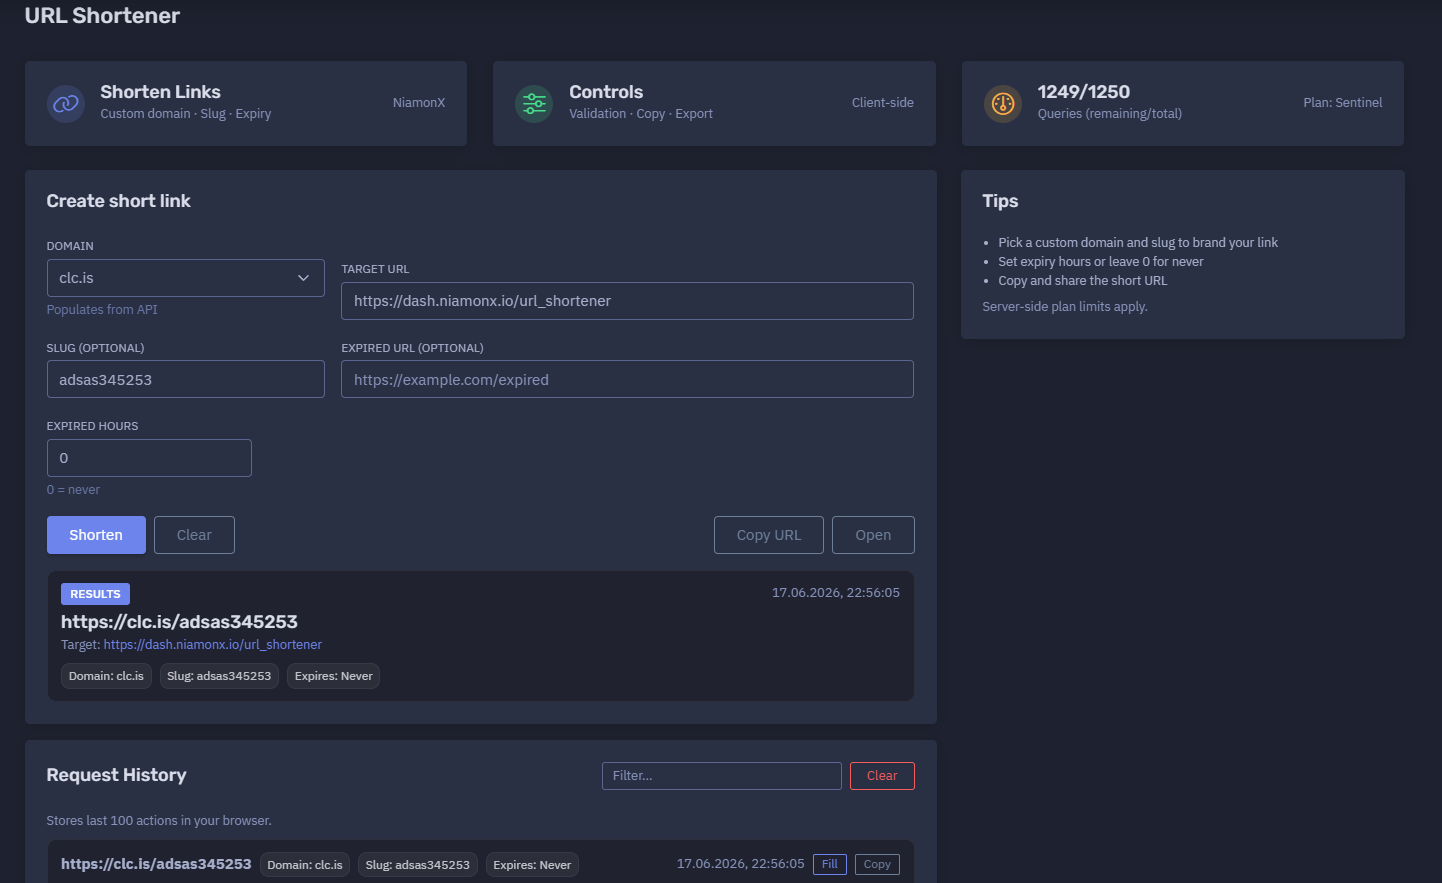
The platform available at https://dash.niamonx.io/url_shortener — known as URL Shortener — is a short link creation tool within the NiamonX platform. It allows users to create branded short URLs using available custom domains, optional custom slugs, optional expiration settings, and an optional expired redirect URL.
The tool is designed for fast and controlled link shortening, link branding, sharing, campaign routing, documentation links, support links, internal workflows, and security-aware URL management.
Overview of the Service
URL Shortener helps users convert long URLs into shorter, cleaner, and easier-to-share links. Instead of sending long dashboard URLs, documentation URLs, campaign links, or support links, users can generate compact short URLs using available NiamonX-connected domains.
The tool supports:
-
custom short link domains;
-
custom slugs;
-
target URL validation;
-
optional expired redirect URL;
-
optional expiration time in hours;
-
copy-friendly short links;
-
local request history;
-
plan-based query limits;
-
client-side controls;
-
export and reuse workflows.
Example generated link:
https://clc.is/adsas345253
Example target URL:
https://dash.niamonx.io/url_shortener
This makes the module useful for support teams, analysts, developers, marketing teams, internal documentation, OSINT workflows, SOC teams, customer communication, and controlled temporary link sharing.
🔍 How the Tool Works
The user selects a short link domain, enters the target URL, optionally defines a custom slug, optionally sets an expired URL, and optionally configures expiration hours.
The tool then creates a short URL that redirects users to the specified target destination.
Example configuration:
Domain: clc.is
Target URL: https://dash.niamonx.io/url_shortener
Slug: adsas345253
Expired URL: https://example.com/expired
Expired hours: 0
Example result:
https://clc.is/adsas345253
Target: https://dash.niamonx.io/url_shortener
Domain: clc.is
Slug: adsas345253
Expires: Never
17.06.2026, 22:56:05
If expiration is set to 0, the short link does not expire.
Example:
Expired hours: 0
0 = never
🧩 Main Use Cases
URL Shortener can be used for many link management workflows.
Common use cases include:
-
creating short links for dashboards;
-
sharing long URLs in a compact format;
-
creating branded support links;
-
creating temporary links;
-
routing expired links to a fallback page;
-
simplifying links for documentation;
-
sharing tools inside reports;
-
creating easy-to-read links for presentations;
-
tracking internal link creation history locally;
-
preparing links for customer support or analyst workflows.
Example:
Long URL:
https://dash.niamonx.io/url_shortener

Short URL:
https://clc.is/adsas345253
⚙️ Create Short Link
The main panel is used to create a new short URL.
Main fields include:
-
Domain
-
Target URL
-
Slug
-
Expired URL
-
Expired hours
Example interface section:
Create short link
Domain: clc.is
Target URL: https://dash.niamonx.io/url_shortener
Slug: adsas345253
Expired URL: https://example.com/expired
Expired hours: 0
After submission, the tool displays the generated short link and its configuration.
🌐 Domain
The Domain field controls which short domain will be used.
Example:
Domain: clc.is
The available domains are populated from the API.
Interface note:
Populates from API
Possible examples:
clc.is
clc.cx
The selected domain becomes the base of the short link.
Example:
https://clc.is/adsas345253
Domain selection is useful for:
-
branding links;
-
separating use cases;
-
choosing a shorter domain;
-
creating campaign-specific links;
-
organizing links by project;
-
using trusted short domains for internal workflows.
🔗 Target URL
The Target URL is the destination where users will be redirected when they open the short link.
Example:
https://dash.niamonx.io/url_shortener
The target should be a complete URL with protocol.
Recommended format:
https://example.com/page
Valid examples:
https://dash.niamonx.io/url_shortener
https://dash.niamonx.io/webscreen
https://support.niamonx.io/
Invalid or incomplete examples:
dash.niamonx.io/url_shortener
www.example.com/page
example.com
localhost
For reliable redirection, users should always include:
https://
or:
http://
🏷️ Slug
The Slug field defines the custom path part of the short link.
Example:
Slug: adsas345253
Generated short URL:
https://clc.is/adsas345253
The slug is optional.
If the user leaves the slug empty, the system may generate or assign a slug automatically, depending on backend behavior.
Example with a custom slug:
https://clc.is/url_shortener
Example with another custom slug:
https://clc.cx/petux
A slug can be useful for:
-
branded links;
-
memorable links;
-
campaign naming;
-
tool shortcuts;
-
documentation references;
-
support links;
-
internal workflow shortcuts.
Good slug examples:
webscreen
url_shortener
support-guide
case-2026-001
Less recommended slug examples:
444444444444444444444444444444
-
adsas345253
Although technical slugs may work, descriptive slugs are easier to manage, trust, and remember.
⏳ Expired URL
The Expired URL field defines where users should be redirected after the short link expires.
Example:
Expired URL: https://example.com/expired
This is optional.
Use cases for an expired URL:
-
redirect users to an expired campaign page;
-
send users to a support article;
-
show a deactivation notice;
-
redirect to a new landing page;
-
route old links to a safe fallback page;
-
prevent broken user experience after expiration.
Example behavior:
Before expiration:
https://clc.is/adsas345253 → https://dash.niamonx.io/url_shortener

After expiration:
https://clc.is/adsas345253 → https://example.com/expired
If no expired URL is provided, backend behavior may depend on platform configuration.
For best user experience, users should provide a clear expired destination when creating temporary links.
🕓 Expired Hours
The Expired hours field controls how long the short link remains active.
Example:
Expired hours: 0
Special value:
0 = never
This means the link does not expire.
Example:
Expires: Never
A non-zero value creates a temporary short link.
Example:
Expired hours: 1
This means the link expires after one hour.
Temporary links are useful for:
-
limited-time access;
-
short campaigns;
-
expiring support links;
-
temporary documentation access;
-
incident response sharing;
-
controlled internal workflows;
-
test links;
-
demo links.
Recommended expiration settings:
| Use Case | Suggested Expiry |
|---|---|
| Permanent documentation shortcut | 0 |
| Temporary support link | 1–24 hours |
| Campaign link | Based on campaign duration |
| Incident response link | 1–72 hours |
| Internal test link | 1–24 hours |
| Demo or training link | 24–168 hours |
| Long-term branded shortcut | 0 |
✅ Results Section
After successful creation, the Results section displays the generated short link and metadata.
Example:
17.06.2026, 22:56:05
https://clc.is/adsas345253
Target: https://dash.niamonx.io/url_shortener
Domain: clc.is
Slug: adsas345253
Expires: Never
Typical result fields include:
| Field | Description |
|---|---|
| Timestamp | Date and time when the short link was created |
| Short URL | The generated short link |
| Target | Destination URL |
| Domain | Selected short domain |
| Slug | Custom or generated slug |
| Expires | Expiration status |
The Results section is useful for quickly copying the generated link and verifying that it points to the correct destination.
📋 Request History
URL Shortener stores recent actions locally in the user’s browser.
Example interface note:
Request History
Filter...
Stores last 100 actions in your browser.
Example history item:
https://clc.is/adsas345253
Domain: clc.is
Slug: adsas345253
Expires: Never
17.06.2026, 22:56:05
Target: https://dash.niamonx.io/url_shortener
The request history helps users:
-
reuse recently created links;
-
check the target of a previous link;
-
copy a short URL again;
-
review slug and domain choices;
-
filter previous actions;
-
confirm expiration settings;
-
continue link management workflows.
Because the history is stored locally in the browser, it may be removed when users clear browser data, switch devices, use a different browser profile, or use private browsing mode.
🚦 Query Limits and Plan Access
URL Shortener uses plan-based query limits.
Example:
1249 / 1250
Queries remaining / total
Plan: Sentinel
Important points:
-
Each short link creation request may consume plan quota.
-
Limits depend on the user’s active plan.
-
Server-side plan limits apply.
-
If the limit is reached, new link creation may be blocked.
-
The interface may keep previous results visible even if a new request fails.
-
Users should monitor remaining queries when creating many links.
Example interface note:
Server-side plan limits apply.
Plan limits help control resource usage and prevent abuse.
🧠 Key Features
Custom Domain Selection
Users can choose from available short link domains provided by the API.
Custom Slug Support
Users can define their own slug for branded, readable, or workflow-specific links.
Target URL Validation
The tool validates the destination URL to reduce invalid or malformed link creation.
Optional Expiration
Users can configure links to expire after a specified number of hours.
Never-Expire Mode
Setting expiration hours to 0 creates a non-expiring link.
Expired Redirect URL
Users can define a fallback destination for expired links.
Copy-Friendly Results
Generated short URLs are displayed clearly for easy copying and sharing.
Local Request History
The tool stores the last 100 actions locally in the browser.
Filtering History
Users can filter request history to find previous links.
Plan-Based Limits
Short link creation is controlled by the user’s active plan.
Client-Side Controls
The interface provides validation, copy, and export-oriented controls on the client side.
🔎 Common Use Cases
Branded Short Links
Create short links using selected custom domains for cleaner and more recognizable sharing.
Example:
https://clc.is/webscreen
Dashboard Shortcuts
Create compact links to NiamonX tools or internal dashboard pages.
Example:
Target: https://dash.niamonx.io/webscreen
Slug: webscreen
Support Links
Create short links for support tickets, helpdesk responses, troubleshooting guides, or customer instructions.
Documentation Links
Create readable shortcuts for long documentation URLs.
Temporary Access Links
Use expiration hours to create time-limited links.
Example:
Expires: 1 h
Campaign or Announcement Links
Use custom slugs to create memorable campaign or announcement URLs.
Incident Response Sharing
Create controlled short links for reports, evidence packages, or internal incident documentation.
Training and Demo Links
Create short, easy-to-type links for presentations, workshops, and training sessions.
Link Routing After Expiry
Use expired URLs to send users to a fallback page after a campaign or temporary workflow ends.
🧾 Example Configurations
Permanent Short Link
Domain: clc.is
Target URL: https://dash.niamonx.io/url_shortener
Slug: url_shortener
Expired URL: —
Expired hours: 0
Result:
https://clc.is/url_shortener
Expires: Never
Best for:
-
stable documentation links;
-
internal tool shortcuts;
-
dashboards;
-
reusable references.
Temporary Short Link
Domain: clc.cx
Target URL: https://dash.niamonx.io/url_shortener
Slug: demo-link
Expired URL: https://example.com/expired
Expired hours: 1
Result behavior:
Active for: 1 hour
After expiry: redirects to https://example.com/expired
Best for:
-
demos;
-
temporary support;
-
time-limited sharing;
-
controlled campaigns;
-
short-lived internal workflows.
Tool Shortcut Link
Domain: clc.is
Target URL: https://dash.niamonx.io/webscreen
Slug: webscreen
Expired hours: 0
Result:
https://clc.is/webscreen
Best for:
-
easy tool access;
-
documentation;
-
team shortcuts;
-
presentations;
-
internal onboarding.
Automatically Assigned Slug
Domain: clc.is
Target URL: https://dash.niamonx.io/url_shortener
Slug: —
Expired hours: 0
Possible result:
(created)
Domain: clc.is
Slug: —
Expires: Never
Backend behavior may assign a slug automatically depending on platform configuration.
🧠 Recommended Workflow
A practical URL Shortener workflow should follow these steps.
1. Select a Domain
Choose the short link domain that should be used.
Example:
clc.is
Use a domain that matches the purpose of the link, brand, or workflow.
2. Enter the Target URL
Paste the full destination URL.
Example:
https://dash.niamonx.io/url_shortener
Make sure the URL includes https:// or http://.
3. Choose a Slug
Enter a custom slug if a readable or branded link is needed.
Example:
url_shortener
Leave it empty if automatic slug generation is preferred.
4. Configure Expiry
Set expiration hours.
Example for no expiration:
Expired hours: 0
Example for a temporary link:
Expired hours: 24
5. Add an Expired URL if Needed
For temporary links, add a fallback URL.
Example:
https://example.com/expired
This improves user experience after the link expires.
6. Create the Short Link
Submit the form and wait for the result.
Example result:
https://clc.is/adsas345253
7. Verify the Result
Check:
Target URL
Domain
Slug
Expiration
Timestamp
Make sure the link points to the intended destination before sharing it.
8. Copy and Share the Link
Copy the generated short URL and share it through the intended channel.
Examples:
-
support ticket;
-
documentation;
-
chat;
-
e-mail;
-
report;
-
presentation;
-
internal wiki;
-
campaign message.
9. Review Local History if Needed
Use request history to find recently created links.
Example:
Filter...
This is useful when the short link was created earlier in the same browser.
🔐 Security Considerations
Short links are convenient, but they should be used carefully.
Important security points:
-
Short links hide the final destination from the visible URL.
-
Users may be cautious when clicking unknown short links.
-
Sensitive target URLs should not be shortened unless necessary.
-
Links to private dashboards should be shared only with authorized users.
-
Expiration should be used for temporary or sensitive workflows.
-
Expired URLs should point to a safe and controlled page.
-
Slugs should not reveal secrets, tokens, credentials, or private case details.
-
Local history may expose previously created links.
-
Shared devices should not retain sensitive link history.
-
Custom slugs may be guessable if they use simple words.
-
Non-expiring links should be reviewed periodically.
Do not place sensitive information directly inside slugs.
Bad examples:
customer-password-reset-token
case-secret-token-123
private-client-incident-admin
Better examples:
case-2026-001
support-guide
webscreen
🛡️ Responsible Use
URL Shortener is intended for legitimate link management, support, documentation, internal workflow, campaign routing, and controlled sharing.
Acceptable use cases include:
-
shortening your own links;
-
creating branded support links;
-
sharing internal documentation;
-
creating temporary links;
-
routing expired links to safe fallback pages;
-
simplifying dashboard URLs;
-
preparing links for reports or presentations;
-
creating team shortcuts;
-
creating customer support references.
Users should follow responsible use principles:
-
Do not use short links for phishing.
-
Do not hide malicious destinations.
-
Do not impersonate trusted services.
-
Do not create misleading slugs.
-
Do not use short links to distribute malware.
-
Do not use the tool for spam campaigns.
-
Do not shorten URLs containing exposed secrets or tokens.
-
Do not share private links with unauthorized users.
-
Use expiration for temporary or sensitive links.
-
Use clear, trustworthy slugs where appropriate.
Short links should make access easier, not deceptive.
📊 Interpreting Results Correctly
A generated short link should be interpreted as a redirect object.
Important notes:
-
The short URL is not the same as the target URL.
-
The short URL redirects to the configured target.
-
The selected domain controls the visible short link base.
-
The slug controls the path of the short link.
-
Expiration controls how long the link remains active.
-
0expiration means the link does not expire. -
The expired URL is used only after expiration, when configured.
-
Local history is browser-side and may not reflect server-side link state.
-
Deleting browser history does not necessarily delete the created server-side short link.
-
Plan limits apply to link creation requests.
-
Users should verify generated links before sharing.
📋 Recommended Link Naming Guidelines
Good slugs should be:
-
readable;
-
short;
-
relevant;
-
non-sensitive;
-
easy to type;
-
easy to recognize;
-
appropriate for the audience;
-
not misleading.
Good examples:
webscreen
url-shortener
support
docs
incident-guide
Avoid slugs that are:
-
too long;
-
random without purpose;
-
offensive;
-
misleading;
-
secret-bearing;
-
impersonating another brand;
-
likely to be guessed when privacy matters.
🧾 Recommended Reporting Format
When documenting created short links, use a consistent format.
Example:
Created: 17.06.2026, 22:56:05
Short URL: https://clc.is/adsas345253
Target URL: https://dash.niamonx.io/url_shortener
Domain: clc.is
Slug: adsas345253
Expires: Never
Expired URL: https://example.com/expired
Plan: Sentinel
For temporary links, document the expiration:
Short URL: https://clc.cx/demo-link
Target URL: https://dash.niamonx.io/url_shortener
Expires: 1 hour
Expired URL: https://example.com/expired
Purpose: temporary demo link
For internal security workflows, also document:
Owner
Purpose
Creation time
Expected audience
Expiration policy
Review date
🧹 Managing Local History
The local request history stores the last 100 actions in the browser.
Example:
Stores last 100 actions in your browser.
Recommended practices:
-
filter history to find recent links;
-
copy previously created short links when needed;
-
clear history on shared devices;
-
avoid creating sensitive links on untrusted browsers;
-
do not rely on local history as the only record of important links;
-
document important links separately in official systems.
Local history is a convenience feature, not a full link management database.
⚙️ Technical Highlights
-
URL shortening tool
-
Available at
dash.niamonx.io/url_shortener -
Creates short links
-
Supports custom short domains
-
Domains populate from API
-
Supports custom slugs
-
Supports target URL validation
-
Supports optional expired URL
-
Supports expiration in hours
-
Supports never-expire mode with
0 -
Shows generated short URL
-
Shows target URL
-
Shows selected domain
-
Shows selected slug
-
Shows expiration status
-
Shows creation timestamp
-
Supports copy-friendly output
-
Stores request history locally
-
Keeps last 100 actions in the browser
-
Supports history filtering
-
Uses plan-based query limits
-
Server-side plan limits apply
-
Suitable for branded links, support links, documentation links, dashboards, temporary sharing, reports, and internal workflows
📌 Usage Hints
-
Pick a custom domain and slug to brand your link.
-
Use a complete target URL with
https://orhttp://. -
Keep slugs short and readable.
-
Do not put secrets or private data in slugs.
-
Set expiry hours for temporary links.
-
Use
0when the link should never expire. -
Add an expired URL for time-limited links.
-
Copy and test the short URL before sharing.
-
Use descriptive slugs for documentation and support links.
-
Use non-guessable slugs for sensitive workflows.
-
Monitor remaining plan queries.
-
Remember that server-side plan limits apply.
-
Use request history to find recently created links.
-
Clear browser history on shared or untrusted devices.
-
Treat short links as redirects and verify the destination before distribution.
📬 Contact Information
For technical, legal, abuse, privacy, or support-related inquiries, users can contact the NiamonX team directly:
support@niamonx.io — Technical Support
other@niamonx.io — General Inquiries
takedown@niamonx.io — Privacy or Data Removal Requests
legal@niamonx.io — Legal and Compliance Matters
Alternative contact channel:
🔗 Helpdesk: https://support.niamonx.io/
Summary
NiamonX URL Shortener is a custom short link creation tool for generating compact redirect URLs. It supports API-provided short domains, custom slugs, target URL validation, optional expired URLs, expiration in hours, never-expire mode, copy-friendly results, local request history, filtering, and plan-based query limits.
The tool is designed for branded short links, support workflows, documentation shortcuts, dashboard links, temporary sharing, campaign routing, internal communication, reports, and presentations. Users should choose clear slugs, verify target URLs before sharing, use expiration for temporary or sensitive workflows, and avoid placing secrets or private information in short links.
DNSSEC Configuration | DNSSEC Validation, Keys & Signature Analysis Tool
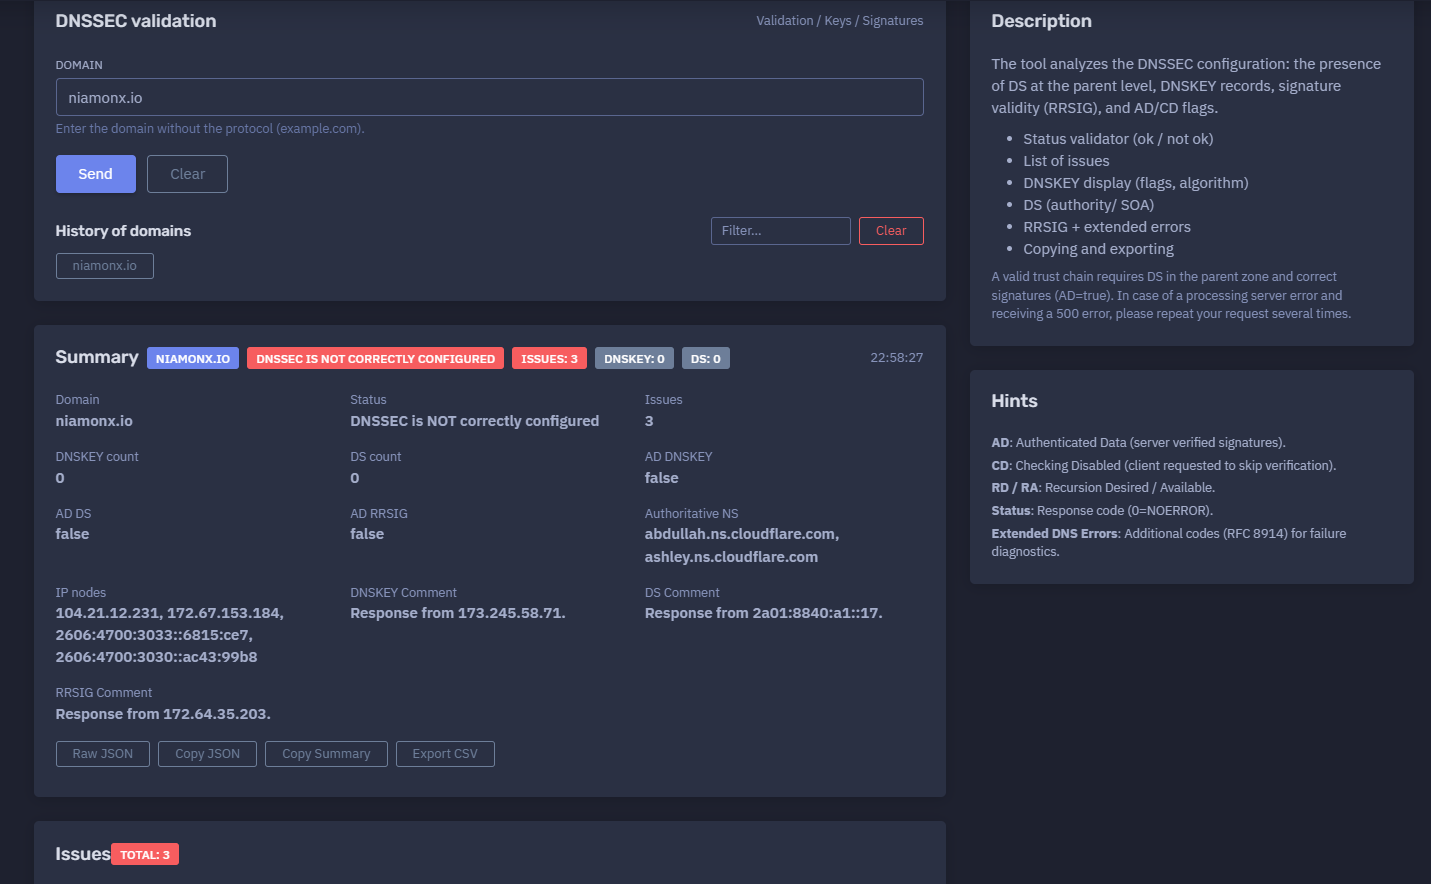
The platform available at https://dash.niamonx.io/dnssec_check — known as DNSSEC Configuration — is a DNSSEC validation and diagnostic tool within the NiamonX platform. It analyzes whether a domain is correctly protected with DNSSEC by checking DS records at the parent zone, DNSKEY records at the authoritative zone, RRSIG signatures, validation flags, DNS response status, authoritative name servers, IP nodes, and detected configuration issues.
The tool helps users understand whether a domain has a valid DNSSEC trust chain or whether DNSSEC is missing, incomplete, misconfigured, or failing validation.
Overview of the Service
DNSSEC Configuration is designed to analyze the DNSSEC state of a domain in a structured and readable way. DNSSEC helps protect DNS responses against tampering by using cryptographic signatures and a chain of trust from the parent zone to the domain’s authoritative DNS zone.
The tool checks several important parts of DNSSEC configuration:
-
DS records at the parent zone
-
DNSKEY records in the domain zone
-
RRSIG signatures
-
AD flag behavior
-
CD flag behavior
-
RD / RA recursion flags
-
DNS response status codes
-
authoritative name servers
-
resolved IP nodes
-
DNSSEC-related issues
-
extended DNS error information, when available
The module is useful for DNS administrators, DevOps engineers, security teams, SOC teams, compliance teams, incident responders, domain owners, infrastructure engineers, and OSINT analysts.
It is especially helpful when users need to answer questions such as:
-
Is DNSSEC enabled for this domain?
-
Is DNSSEC correctly configured?
-
Are DNSKEY records present?
-
Is there a DS record in the parent zone?
-
Are DNSSEC signatures validated successfully?
-
Is the AD flag set?
-
Which authoritative name servers are involved?
-
Which DNS nodes are returned?
-
What issues prevent a valid DNSSEC trust chain?
-
Are there extended DNS errors that explain the failure?
🔍 How the Tool Works
When a user enters a domain, DNSSEC Configuration performs DNSSEC-related DNS queries and analyzes the results.
Example input:
Domain: niamonx.io
Example summary result:
niamonx.io
DNSSEC is NOT correctly configured
Issues: 3
DNSKEY: 0
DS: 0
22:58:27
The tool may perform checks for:
-
DNSKEY records
-
DS records
-
RRSIG records
-
AD flag validation
-
CD flag state
-
RD / RA recursion behavior
-
authoritative name servers
-
IP nodes
-
DNS response status
-
SOA / authority records
-
extended DNS errors
The result is organized into multiple sections:
-
Summary
-
Domain status
-
Issues
-
DNSKEY query
-
DS query
-
RRSIG query
-
DNS Chain
-
Authoritative NS
-
IP nodes
-
local history
🧩 Supported Input
DNSSEC Configuration accepts domain names only.
Correct input examples:
niamonx.io
example.com
cloudflare.com
sub.example.com
Incorrect input examples:
https://niamonx.io
http://example.com
https://example.com/path
example.com/path
user@example.com
192.168.1.1
localhost
Interface guidance:
Enter the domain without the protocol (example.com).
Users should enter only the domain name, without http://, https://, path, query string, fragment, wildcard, or e-mail formatting.
📊 Summary Section
The Summary section provides a compact DNSSEC status overview.
Example:
niamonx.io
DNSSEC is NOT correctly configured
Issues: 3
DNSKEY: 0
DS: 0
22:58:27
Typical fields include:
| Field | Description |
|---|---|
| Domain | The checked domain |
| Status | DNSSEC validation result |
| Issues | Number of detected configuration problems |
| DNSKEY | Number of DNSKEY records found |
| DS | Number of DS records found |
| Time | Query or result timestamp |
The Summary section is useful for quick triage. It immediately shows whether the domain appears to have a valid DNSSEC configuration or whether further investigation is needed.
✅ Status Validator
The tool provides a clear status result.
Example:
DNSSEC is NOT correctly configured
Possible high-level outcomes may include:
-
DNSSEC is correctly configured
-
DNSSEC is not correctly configured
-
DNSSEC validation failed
-
DNSSEC data is missing
-
DNSSEC status could not be fully determined
A valid DNSSEC configuration normally requires:
DS record in the parent zone
DNSKEY record in the authoritative zone
Valid RRSIG signatures
Successful validation
AD=true
If one or more of these components are missing or invalid, the domain may fail DNSSEC validation.
🧾 Domain Details
The detailed result section shows the checked domain and DNSSEC-related values.
Example:
Domain: niamonx.io
Status: DNSSEC is NOT correctly configured
Issues: 3
DNSKEY count: 0
DS count: 0
AD DNSKEY: false
AD DS: false
AD RRSIG: false
Authoritative NS: abdullah.ns.cloudflare.com, ashley.ns.cloudflare.com
IP nodes: 104.21.12.231, 172.67.153.184, 2606:4700:3033::6815:ce7, 2606:4700:3030::ac43:99b8
This section helps users understand both the DNSSEC state and the DNS infrastructure involved in the result.
🔐 DNSSEC Trust Chain
DNSSEC depends on a chain of trust.
A simplified trust chain looks like this:
Root zone
→ TLD parent zone
→ Domain DS record
→ Domain DNSKEY record
→ Signed DNS records
→ Validated response
For DNSSEC to validate correctly:
-
The parent zone must publish a DS record for the domain.
-
The domain’s authoritative zone must publish matching DNSKEY records.
-
DNS records must be signed with valid RRSIG signatures.
-
A validating resolver must be able to verify the signatures.
-
The response should set
AD=truewhen validation succeeds.
If the DS record is missing, the chain of trust cannot be established from the parent zone.
If DNSKEY records are missing, the domain zone cannot provide the public keys needed to validate signatures.
If RRSIG records are missing or invalid, DNSSEC-signed data cannot be validated.
🚨 Issues Section
The Issues section lists detected DNSSEC problems.
Example:
Issues
Total: 3

#1 Missing DNSKEY record
#2 Missing DS record
#3 No Authenticated Data (AD flag not set)
Issues help users quickly identify what needs to be fixed.
Common issues may include:
-
missing DNSKEY record;
-
missing DS record;
-
missing RRSIG record;
-
invalid signatures;
-
expired signatures;
-
mismatched DS and DNSKEY;
-
DNSSEC chain validation failure;
-
AD flag not set;
-
unsupported algorithm;
-
broken delegation;
-
inconsistent authoritative responses;
-
resolver validation failure.
Each issue should be reviewed in the context of the domain’s DNS provider, registrar configuration, and authoritative zone settings.
🔑 DNSKEY Section
The DNSKEY section shows DNSKEY query details and DNSKEY records when available.
Example:
DNSKEY
AD: false
Status: 0
AD: false
CD: false
RD: true
RA: true
TC: false
Status 0
No DNSKEY records
DNSKEY records contain public keys used to validate DNSSEC signatures.
A DNSKEY record may include:
| Field | Description |
|---|---|
| Data | DNSKEY record data |
| Flags | Key role indicator |
| Proto | DNSSEC protocol field |
| Algo | Cryptographic algorithm |
| TTL | Time to live |
Example table when no records exist:
# Data Flags Proto Algo TTL
No DNSKEY records
If no DNSKEY records are found, the domain zone does not provide the public keys required for DNSSEC validation.
🧬 DNSKEY Flags
DNSKEY flags help identify the type of key.
Common values include:
| Flag | Meaning |
|---|---|
| 256 | Zone Signing Key, often called ZSK |
| 257 | Key Signing Key, often called KSK |
The exact DNSSEC key structure depends on the DNS provider and deployment model.
In a typical DNSSEC configuration:
-
the KSK signs the DNSKEY set;
-
the ZSK signs ordinary zone records;
-
the DS record in the parent zone is derived from the KSK.
If DNSKEY records are missing, DNSSEC cannot be validated at the domain zone level.
🧾 DS Section
The DS section shows DS query results from the parent zone or authority response.
Example:
DS
AD: false
Status: 0
AD: false
CD: false
RD: true
RA: true
TC: false
Status 0
A DS record connects the parent zone to the child domain’s DNSKEY.
A valid DS record is required for a complete DNSSEC trust chain.
If the DS record is missing, the parent zone does not delegate DNSSEC trust to the domain.
Example issue:
Missing DS record
The DS section may also show authority records such as SOA, DS, RRSIG, or NSEC/NSEC3-related data.
a0.nic.io. hostmaster.donuts.email. 1781729005 7200 900 1209600 3600
This information can help diagnose whether the parent zone returned a negative answer, an authority response, or related DNSSEC denial-of-existence data.
🧷 RRSIG Section
The RRSIG section shows signature query information.
Example:
RRSIG Query
AD: false
Status: 0
AD: false
CD: false
RD: true
RA: true
TC: false
Status 0
Response from 172.64.35.203.
RRSIG records contain cryptographic signatures for DNS records.
RRSIG is important because it proves that DNS records were signed by the domain’s DNSSEC keys.
A valid DNSSEC response generally requires:
-
signed DNS records;
-
valid signatures;
-
non-expired signatures;
-
matching DNSKEY records;
-
a valid DS chain from the parent zone;
-
successful validation by the resolver.
If RRSIG validation fails or no authenticated data is returned, the tool may show an issue such as:
No Authenticated Data (AD flag not set)
🏁 AD Flag
AD means Authenticated Data.
Interface hint:
AD: Authenticated Data (server verified signatures).
Example:
AD DNSKEY: false
AD DS: false
AD RRSIG: false
When AD=true, the validating resolver indicates that DNSSEC validation succeeded for the response.
When AD=false, it may mean:
-
the domain is not signed;
-
DNSSEC is not configured;
-
validation failed;
-
the resolver did not validate the response;
-
the trust chain is incomplete;
-
the queried data was not authenticated.
For a correctly validated DNSSEC response, AD=true is an important positive signal.
🚫 CD Flag
CD means Checking Disabled.
Interface hint:
CD: Checking Disabled (client requested to skip verification).
Example:
CD: false
When CD=true, the client asks the resolver not to perform DNSSEC validation.
When CD=false, DNSSEC validation is not intentionally disabled by the query.
The CD flag is useful for diagnosing whether DNSSEC failures are caused by validation behavior or by the underlying DNSSEC configuration.
🔁 RD and RA Flags
RD means Recursion Desired.
RA means Recursion Available.
Interface hint:
RD / RA: Recursion Desired / Available.
Example:
RD: true
RA: true
Meaning:
| Flag | Description |
|---|---|
| RD | The client requested recursive resolution |
| RA | The resolver supports recursive resolution |
These flags help users understand how the DNS query was processed.
🧯 TC Flag
TC means Truncated.
Example:
TC: false
If TC=true, the DNS response was truncated. This can happen when the response is too large for the transport method and may require retrying over TCP.
A truncated DNSSEC response can affect diagnostics because DNSSEC records may be large.
📟 DNS Status Code
The Status field shows the DNS response code.
Interface hint:
Status: Response code (0=NOERROR).
Example:
Status: 0
Common DNS response codes include:
| Code | Meaning |
|---|---|
| 0 | NOERROR |
| 1 | FORMERR |
| 2 | SERVFAIL |
| 3 | NXDOMAIN |
| 4 | NOTIMP |
| 5 | REFUSED |
A status of 0 means the DNS response itself returned NOERROR, but it does not automatically mean DNSSEC is correctly configured. DNSSEC may still be missing or unauthenticated.
🧭 Authoritative Name Servers
The DNS Chain section displays authoritative name servers for the domain.
Example:
Authoritative NS:
abdullah.ns.cloudflare.com
ashley.ns.cloudflare.com
This information is useful for:
-
identifying the DNS provider;
-
troubleshooting DNSSEC setup;
-
confirming authoritative infrastructure;
-
checking whether the correct provider is serving the zone;
-
comparing registrar and DNS provider configuration;
-
diagnosing inconsistent records.
If DNSSEC is missing or broken, the authoritative DNS provider configuration should be reviewed.
🌐 IP Nodes
The DNS Chain section may also show IP nodes associated with the domain or authoritative resolution path.
Example:
IP nodes:
104.21.12.231
172.67.153.184
2606:4700:3033::6815:ce7
2606:4700:3030::ac43:99b8
IP nodes are useful for understanding the infrastructure returned by DNS resolution.
They may represent:
-
CDN edge addresses;
-
web service addresses;
-
cloud provider infrastructure;
-
IPv4 addresses;
-
IPv6 addresses;
-
provider-managed routing endpoints.
IP nodes should not be confused with DNSSEC keys. They are infrastructure addresses, not DNSSEC trust records.
💬 Query Comments
The tool may display comments showing where a response came from.
Examples:
DNSKEY Comment: Response from 173.245.58.71.
DS Comment: Response from 2a01:8840:a1::17.
RRSIG Comment: Response from 172.64.35.203.
These comments are useful for diagnostics because they show which resolver or server returned the response.
Response comments can help analysts identify:
-
which server answered;
-
whether IPv4 or IPv6 was involved;
-
which infrastructure path was used;
-
whether different queries were answered by different nodes.
🧠 Extended DNS Errors
Extended DNS Errors provide additional diagnostic information for DNS failures.
Interface hint:
Extended DNS Errors: Additional codes (RFC 8914) for failure diagnostics.
Extended DNS Errors may help explain:
-
DNSSEC validation failure;
-
unsupported algorithm;
-
stale answer;
-
blocked query;
-
filtered response;
-
network error;
-
resolver policy issue;
-
invalid data;
-
missing signature;
-
bogus DNSSEC state.
If extended errors are present, they should be reviewed together with DNSKEY, DS, RRSIG, and response flags.
🕓 History of Domains
DNSSEC Configuration stores recently checked domains locally in the browser.
Example interface section:
History of domains
Filter...
History helps users:
-
repeat previous DNSSEC checks;
-
compare recent domain states;
-
continue troubleshooting sessions;
-
filter previously checked domains;
-
revisit domains after DNS changes.
Because history is stored locally, it may be removed when browser data is cleared, a private browsing session is used, or the user switches devices or browser profiles.
📤 Copying and Exporting
DNSSEC Configuration supports copying and exporting results.
Available actions may include:
-
copy summary;
-
copy DNSSEC issues;
-
copy DNSKEY data;
-
copy DS data;
-
copy RRSIG results;
-
copy raw diagnostic output;
-
export results for reporting.
Copying and exporting are useful for:
-
DNS troubleshooting tickets;
-
registrar support requests;
-
DNS provider support cases;
-
compliance reports;
-
SOC notes;
-
incident response documentation;
-
domain security reviews;
-
technical audit evidence.
🔎 Common Use Cases
DNSSEC Configuration Check
Verify whether a domain has DNSSEC enabled and correctly configured.
Domain Security Audit
Review DNSSEC status as part of a broader domain security assessment.
Registrar Configuration Review
Check whether DS records are published correctly at the parent zone.
DNS Provider Troubleshooting
Check whether DNSKEY and RRSIG records exist in the authoritative DNS zone.
Incident Response
Investigate whether DNS tampering protection is enabled for a domain involved in an incident.
Compliance Documentation
Document DNSSEC posture for compliance, audit, or risk management.
Migration Validation
Verify DNSSEC after changing DNS providers, registrars, nameservers, or signing configuration.
Broken DNSSEC Diagnosis
Identify whether validation failures are caused by missing DS, missing DNSKEY, invalid signatures, or resolver behavior.
Infrastructure Review
OSINT and Defensive Research
Check DNSSEC posture of domains during domain intelligence or external attack surface review.
🧠 Recommended Workflow
A practical DNSSEC Configuration workflow should follow these steps.
1. Enter the Domain
Use only the domain name.
Example:
niamonx.io
Do not enter:
https://niamonx.io
2. Review the Summary
Start with the high-level status.
Example:
DNSSEC is NOT correctly configured
Issues: 3
DNSKEY: 0
DS: 0
This quickly shows whether DNSSEC is working or requires troubleshooting.
3. Review the Issues List
Check every issue reported by the tool.
Example:
Missing DNSKEY record
Missing DS record
No Authenticated Data (AD flag not set)
The issue list provides the most direct explanation of the DNSSEC problem.
4. Check DS Records
Review whether the parent zone publishes a DS record.
Example issue:
Missing DS record
If DS is missing, DNSSEC trust cannot be established from the parent zone.
This is often configured at the domain registrar.
5. Check DNSKEY Records
Review whether DNSKEY records exist in the authoritative zone.
Example issue:
Missing DNSKEY record
If DNSKEY is missing, the domain zone is not providing public keys for DNSSEC validation.
This is usually configured at the DNS provider.
6. Check RRSIG and AD Flag
Review whether signatures are present and whether authenticated data is returned.
Example:
AD RRSIG: false
If AD=false, the response was not authenticated by the validating resolver.
7. Review Authoritative Name Servers
Confirm that the expected name servers are authoritative.
Example:
abdullah.ns.cloudflare.com
ashley.ns.cloudflare.com
If the domain recently changed DNS providers, make sure the registrar and authoritative DNS provider are aligned.
8. Review IP Nodes
Check which IP nodes were returned.
Example:
104.21.12.231
172.67.153.184
2606:4700:3033::6815:ce7
2606:4700:3030::ac43:99b8
This helps understand the visible DNS infrastructure, although these IPs are not DNSSEC records.
9. Review Extended Errors
If extended DNS errors are present, use them to diagnose the failure.
Possible reasons may include:
-
validation failure;
-
missing signature;
-
bogus DNSSEC state;
-
unsupported algorithm;
-
resolver policy issue;
-
stale DNSSEC data.
10. Export or Copy Results
Save the DNSSEC diagnostic output for troubleshooting.
Recommended record:
Domain: niamonx.io
Status: DNSSEC is NOT correctly configured
Issues: 3
DNSKEY count: 0
DS count: 0
AD DNSKEY: false
AD DS: false
AD RRSIG: false
Authoritative NS: abdullah.ns.cloudflare.com, ashley.ns.cloudflare.com
Checked at: 22:58:27
🧰 DNSSEC Troubleshooting Guide
Missing DS Record
Issue:
Missing DS record
Meaning:
The parent zone does not publish a DS record for the domain.
Possible causes:
-
DNSSEC was not enabled at the registrar;
-
DS record was not submitted;
-
DS record was removed;
-
registrar configuration is incomplete;
-
DNSSEC setup was started but not finalized;
-
domain was moved to another DNS provider without updating DS.
Recommended actions:
-
check DNSSEC settings at the registrar;
-
obtain DS record from the DNS provider;
-
publish DS at the parent zone through the registrar;
-
wait for DNS propagation;
-
rerun the DNSSEC check.
Missing DNSKEY Record
Issue:
Missing DNSKEY record
Meaning:
Possible causes:
-
DNSSEC is not enabled at the DNS provider;
-
the DNS provider does not serve signed records;
-
DNSSEC was disabled;
-
the domain uses name servers that are not configured for DNSSEC;
-
the zone is not signed.
Recommended actions:
-
enable DNSSEC at the authoritative DNS provider;
-
confirm that the zone is signed;
-
verify that DNSKEY records are published;
-
confirm that the registrar uses matching DS records;
-
rerun the check after propagation.
AD Flag Not Set
Issue:
No Authenticated Data (AD flag not set)
Meaning:
The resolver did not return authenticated DNSSEC-validated data.
Possible causes:
-
DNSSEC is not configured;
-
DNSSEC chain is incomplete;
-
signatures are missing or invalid;
-
resolver did not validate the response;
-
DS and DNSKEY do not match;
-
the response is unsigned;
-
DNSSEC validation failed.
Recommended actions:
-
check DS records;
-
check DNSKEY records;
-
check RRSIG records;
-
verify the resolver supports DNSSEC validation;
-
review extended DNS errors;
-
rerun the test after DNS changes.
Status 0 but DNSSEC Not Valid
A DNS status code of 0 means NOERROR, but this only means the DNS query succeeded.
Example:
Status: 0
This does not mean DNSSEC is correctly configured.
A domain can return NOERROR while still having:
-
no DS record;
-
no DNSKEY record;
-
no RRSIG;
-
no AD flag;
-
invalid DNSSEC chain.
Always review DNSSEC-specific fields, not only the DNS response status.
🚦 Server Errors and Retry Behavior
In some cases, the processing server may return an error.
Interface note:
In case of a processing server error and receiving a 500 error, please repeat your request several times.
A temporary server-side error may be caused by:
-
resolver timeout;
-
upstream DNS failure;
-
transient network problem;
-
DNS provider response issue;
-
processing timeout;
-
temporary backend error.
If this happens, repeat the request. If the issue continues, compare results with another DNSSEC validation method and contact support if needed.
📊 Interpreting Results Correctly
DNSSEC Configuration results should be interpreted carefully.
Important notes:
-
Missing DNSKEY means the zone does not expose DNSSEC keys.
-
Missing DS means the parent zone does not establish DNSSEC trust.
-
AD=false means the response was not authenticated by the validating resolver.
-
Status 0 means DNS query success, not DNSSEC success.
-
A domain may resolve normally even when DNSSEC is not configured.
-
DNSSEC protects DNS integrity, not website content.
-
DNSSEC does not replace HTTPS or TLS.
-
DNSSEC misconfiguration can cause resolution failures for validating resolvers.
-
DNSSEC changes may require propagation time.
-
Registrar and DNS provider settings must match.
-
DNS provider migration can break DNSSEC if DS records are not updated.
-
DNSSEC validation should be retested after changes.
DNSSEC is one layer of domain security. It should be used together with HTTPS, HSTS, secure registrar accounts, MFA, DNS change monitoring, SPF, DKIM, DMARC, and proper access control.
🧾 Recommended Reporting Format
When documenting DNSSEC status, use a consistent structure.
Example:
Domain: niamonx.io
Check time: 22:58:27

Status:
DNSSEC is NOT correctly configured

Issues:
1. Missing DNSKEY record
2. Missing DS record
3. No Authenticated Data (AD flag not set)

Counts:
DNSKEY: 0
DS: 0

Flags:
AD DNSKEY: false
AD DS: false
AD RRSIG: false

Authoritative name servers:
- abdullah.ns.cloudflare.com
- ashley.ns.cloudflare.com

IP nodes:
- 104.21.12.231
- 172.67.153.184
- 2606:4700:3033::6815:ce7
- 2606:4700:3030::ac43:99b8
For a remediation report, add:
Recommended remediation:
Enable DNSSEC signing at the authoritative DNS provider, publish DNSKEY records, add the matching DS record at the registrar or parent zone, wait for propagation, and rerun DNSSEC validation until AD=true is returned.
🛡️ Security, Privacy & Responsible Use
DNSSEC Configuration is intended for lawful DNS security analysis, infrastructure review, compliance, troubleshooting, and defensive cybersecurity workflows.
Acceptable use cases include:
-
checking your own domains;
-
auditing customer domains with authorization;
-
validating DNSSEC after DNS changes;
-
troubleshooting broken DNSSEC;
-
reviewing registrar and DNS provider configuration;
-
documenting domain security posture;
-
supporting compliance checks;
-
investigating DNS-related incidents;
-
reviewing external attack surface;
-
validating DNSSEC deployment status.
Users should follow responsible use principles:
-
Do not treat DNSSEC failure as proof of compromise.
-
Do not make attribution claims based only on DNSSEC status.
-
Validate important findings with additional DNS tools.
-
Use results as technical diagnostics, not legal conclusions.
-
Store domain security reports securely.
-
Follow authorization boundaries when auditing third-party domains.
-
Coordinate DNSSEC changes carefully to avoid outages.
-
Confirm registrar and DNS provider settings before publishing DS records.
DNSSEC misconfiguration can affect domain availability. Changes should be planned and tested carefully.
⚙️ Technical Highlights
-
DNSSEC validation tool
-
Available at
dash.niamonx.io/dnssec_check -
Checks domain DNSSEC configuration
-
Accepts domains without protocol
-
Validates DS records at parent level
-
Checks DNSKEY records
-
Checks RRSIG signatures
-
Reports AD flag state
-
Reports CD flag state
-
Reports RD and RA flags
-
Reports TC flag
-
Displays DNS response status code
-
Shows DNSKEY count
-
Shows DS count
-
Displays DNSKEY flags, protocol, algorithm, and TTL when available
-
Displays DS authority / SOA information
-
Displays RRSIG query results
-
Shows extended DNS errors when available
-
Lists DNSSEC issues
-
Shows authoritative name servers
-
Shows IP nodes
-
Provides DNS query comments
-
Supports copying and exporting
-
Maintains local domain history
-
Supports history filtering
-
Suitable for DNS administrators, DevOps, SOC, compliance, incident response, OSINT, and domain security reviews
📌 Usage Hints
-
Enter only the domain, such as
example.com. -
Do not include
https://orhttp://. -
Review the Summary section first.
-
Check whether the status is OK or not OK.
-
Review the Issues list before looking at raw DNS data.
-
A valid trust chain requires DS in the parent zone.
-
A valid zone requires DNSKEY records.
-
DNSSEC-signed records require valid RRSIG signatures.
-
AD=trueindicates authenticated data from a validating resolver. -
CD=truemeans checking was disabled. -
RD=truemeans recursion was requested. -
RA=truemeans recursion was available. -
Status 0means NOERROR, not necessarily DNSSEC success. -
Review Extended DNS Errors for failure diagnostics.
-
Check authoritative name servers when troubleshooting.
-
Retest after DNSSEC changes and propagation.
-
Repeat the request if a temporary server-side 500 error occurs.
-
Use exported results for registrar or DNS provider support cases.
-
Treat DNSSEC as one part of a broader domain security posture.
📬 Contact Information
For technical, legal, abuse, privacy, or support-related inquiries, users can contact the NiamonX team directly:
support@niamonx.io — Technical Support
other@niamonx.io — General Inquiries
takedown@niamonx.io — Privacy or Data Removal Requests
legal@niamonx.io — Legal and Compliance Matters
Alternative contact channel:
🔗 Helpdesk: https://support.niamonx.io/
Summary
NiamonX DNSSEC Configuration is a DNSSEC validation and diagnostics tool for checking whether a domain has a valid DNSSEC configuration. It analyzes DS records, DNSKEY records, RRSIG signatures, AD/CD flags, RD/RA flags, DNS response status, authoritative name servers, IP nodes, issues, comments, and extended DNS error information.
The tool is designed for DNS security audits, domain hardening, compliance checks, DNS provider troubleshooting, registrar validation, incident response, OSINT, and infrastructure review. A correct DNSSEC trust chain requires a valid DS record in the parent zone, DNSKEY records in the authoritative zone, valid signatures, and authenticated DNS responses. Results should be interpreted as DNSSEC diagnostics and combined with broader domain security checks such as HTTPS, TLS, HSTS, registrar security, SPF, DKIM, DMARC, DNS monitoring, and access control.
DMARC Policy & Configuration | DMARC Record Analysis Tool
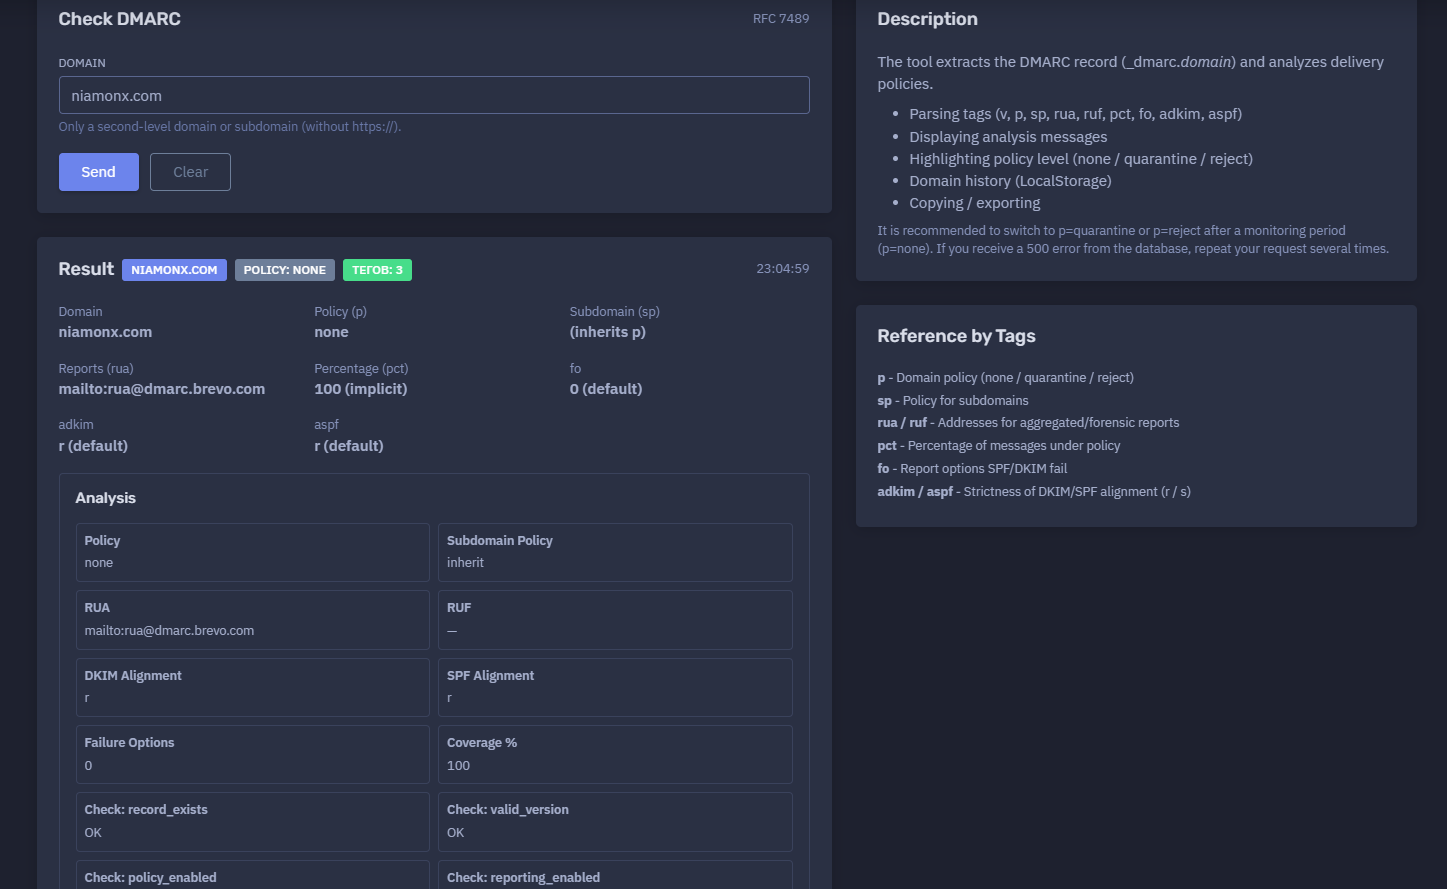
The platform available at https://dash.niamonx.io/dmarc_check — known as DMARC Policy & Configuration — is an e-mail domain security analysis tool within the NiamonX platform. It checks whether a domain has a valid DMARC record, extracts and parses DMARC tags, identifies the active policy, analyzes reporting configuration, evaluates alignment settings, highlights security gaps, and provides a practical risk score.
The tool helps domain owners, security teams, SOC analysts, administrators, compliance teams, and investigators understand how a domain handles unauthenticated e-mail and whether its DMARC configuration is strong enough to protect against spoofing and phishing.
Overview of the Service
DMARC Policy & Configuration analyzes the DMARC record published at:
_dmarc.domain
DMARC, which stands for Domain-based Message Authentication, Reporting, and Conformance, is an e-mail authentication policy framework. It works together with SPF and DKIM to help receiving mail servers determine whether messages claiming to come from a domain are legitimate.
The tool checks the DMARC TXT record, parses its tags, displays the active policy, and evaluates whether the domain is using a monitoring-only policy or an enforcement policy.
The module can analyze:
-
DMARC record existence
-
DMARC version validity
-
domain policy
-
subdomain policy
-
aggregate reporting addresses
-
forensic reporting addresses
-
DKIM alignment mode
-
SPF alignment mode
-
failure reporting options
-
policy coverage percentage
-
security posture
-
risk score
-
parsed DMARC tags
-
analysis checks
-
exportable results
This makes the tool useful for e-mail security audits, anti-phishing hardening, domain protection, compliance reviews, brand protection, SOC workflows, and infrastructure security assessments.
🔍 How the Tool Works
When a user enters a domain, the tool queries the DMARC TXT record for that domain and analyzes the returned policy.
Example input:
Domain: niamonx.com
The tool checks the DNS location:
_dmarc.niamonx.com
Example result:
Domain: niamonx.com
Policy: none
Tags: 3
23:04:59
Example parsed DMARC record:
v=DMARC1; p=none; rua=mailto:rua@dmarc.brevo.com
Example analysis result:
record_exists: OK
valid_version: OK
policy_enabled: FAIL
reporting_enabled: OK
strict_alignment: FAIL
Risk Score: 40 / 100
The result helps users understand whether DMARC is present, whether it is only monitoring mail, whether reports are enabled, and whether stricter protection should be considered.
🧩 Supported Input
DMARC Policy & Configuration accepts second-level domains and subdomains.
Correct examples:
niamonx.com
example.com
sub.example.com
company.org
Incorrect examples:
https://niamonx.com
http://example.com
https://example.com/path
user@example.com
192.168.1.1
_dmarc.example.com
Interface guidance:
Only a second-level domain or subdomain (without https://).
Users should enter only the domain or subdomain. The tool automatically checks the correct DMARC DNS location by querying _dmarc. in front of the submitted domain.
📊 Result Section
The Result section provides a quick summary of the DMARC configuration.
Example:
niamonx.com
Policy: none
Tags: 3
23:04:59
Typical fields include:
| Field | Description |
|---|---|
| Domain | The checked domain |
| Policy | Active DMARC domain policy |
| Tags | Number of parsed DMARC tags |
| Time | Query or result timestamp |
The Result section is useful for quick triage. It immediately shows whether the domain has a DMARC policy and whether that policy is monitoring-only or enforcement-based.
🧾 Domain Details
The detailed result view shows the parsed DMARC configuration.
Example:
Domain: niamonx.com
Policy (p): none
Subdomain (sp): (inherits p)
Reports (rua): mailto:rua@dmarc.brevo.com
Percentage (pct): 100 (implicit)
fo: 0 (default)
adkim: r (default)
aspf: r (default)
This view helps users understand both explicit and implicit DMARC values.
Some values may be shown as default because they were not explicitly present in the DNS record but are defined by DMARC behavior.
🛡️ Policy Field
The Policy (p) field defines what receiving mail servers should do when a message fails DMARC validation.
Example:
Policy (p): none
DMARC supports three main policy levels:
| Policy | Meaning |
|---|---|
| none | Monitor only; do not request enforcement |
| quarantine | Treat failing messages as suspicious |
| reject | Reject failing messages |
p=none
Example:
p=none
p=none means that the domain is collecting DMARC information but is not asking receivers to quarantine or reject failing messages.
This is useful during initial deployment and monitoring, but it does not provide strong spoofing protection by itself.
p=quarantine
Example:
p=quarantine
p=quarantine requests that receiving mail servers treat DMARC-failing messages as suspicious. These messages may be placed in spam or quarantine.
p=reject
Example:
p=reject
p=reject is the strongest policy. It requests that receiving mail servers reject messages that fail DMARC validation.
For mature configurations, p=reject is usually the strongest anti-spoofing posture.
🧭 Subdomain Policy
The Subdomain Policy (sp) field controls how DMARC should apply to subdomains.
Example:
Subdomain (sp): (inherits p)
If sp is not defined, subdomains inherit the main domain policy.
Example:
p=none
sp not defined
Result: subdomains inherit p=none
Possible sp values include:
sp=none
sp=quarantine
sp=reject
The subdomain policy is important because attackers may try to spoof or abuse subdomains if the root domain has incomplete enforcement.
Recommended practice:
-
define
spexplicitly for high-value domains; -
use
sp=quarantineorsp=rejectwhen subdomain mail flows are understood; -
review legitimate subdomain mail senders before enforcement.
📬 Aggregate Reports: RUA
The rua tag defines where aggregate DMARC reports should be sent.
Example:
rua=mailto:rua@dmarc.brevo.com
Aggregate reports provide summarized information about mail claiming to come from the domain.
They may include:
-
sending IP addresses;
-
authentication results;
-
SPF alignment results;
-
DKIM alignment results;
-
message counts;
-
policy evaluation results;
-
receiver information;
-
pass/fail statistics.
In the tool result, RUA may be shown as:
Reports (rua): mailto:rua@dmarc.brevo.com
Reporting is important because it allows domain owners to monitor legitimate and unauthorized e-mail sources before moving to stricter policies.
🧪 Forensic Reports: RUF
The ruf tag defines where forensic or failure reports may be sent.
Example:
ruf=mailto:forensic@example.com
If no forensic report address is configured, the tool may show:
RUF: —
Forensic reports can contain more detailed failure information, but support varies between receivers and privacy restrictions may limit their availability.
RUF should be configured carefully because failure reports may contain sensitive message details or metadata.
📈 Percentage: PCT
The pct tag defines the percentage of messages to which the DMARC policy should be applied.
Example:
pct=100
If pct is not explicitly defined, the tool may show:
Percentage (pct): 100 (implicit)
This means the policy applies to 100% of relevant messages by default.
Use cases for pct:
-
gradual enforcement rollout;
-
testing quarantine or reject policies;
-
limiting impact during migration;
-
phased deployment for large mail environments.
Example phased rollout:
p=quarantine; pct=25
p=quarantine; pct=50
p=quarantine; pct=100
p=reject; pct=25
p=reject; pct=50
p=reject; pct=100
⚙️ Failure Options: FO
The fo tag controls failure reporting options.
Example default:
fo: 0 (default)
Common values include:
| Value | Meaning |
|---|---|
| 0 | Generate reports if both SPF and DKIM fail to produce an aligned pass |
| 1 | Generate reports if either SPF or DKIM fails |
| d | Generate reports if DKIM fails |
| s | Generate reports if SPF fails |
The default value is:
fo=0
Failure options are mainly relevant when forensic reporting is configured and supported.
🔐 DKIM Alignment: ADKIM
The adkim tag defines DKIM alignment strictness.
Example default:
adkim: r (default)
Possible values:
| Value | Meaning |
|---|---|
| r | Relaxed alignment |
| s | Strict alignment |
Relaxed DKIM alignment allows organizational-domain alignment.
Strict DKIM alignment requires a closer match between the DKIM signing domain and the visible From domain.
Example:
adkim=s
Strict alignment provides stronger control but may break legitimate mail if third-party senders are not configured properly.
🔐 SPF Alignment: ASPF
The aspf tag defines SPF alignment strictness.
Example default:
aspf: r (default)
Possible values:
| Value | Meaning |
|---|---|
| r | Relaxed alignment |
| s | Strict alignment |
Relaxed SPF alignment allows organizational-domain alignment between the SPF-authenticated domain and the visible From domain.
Strict SPF alignment requires a closer match.
Example:
aspf=s
Strict SPF alignment can improve security but should be enabled only after confirming all legitimate mail sources are correctly aligned.
🧾 Parsed Tags Table
The tool displays parsed DMARC tags in a structured table.
Example:
| Tag | Value | Description |
|---|---|---|
| v | DMARC1 | Protocol version |
| p | none | Policy for domain |
| rua | mailto:rua@dmarc.brevo.com | Aggregate report URIs |
Example record:
v=DMARC1; p=none; rua=mailto:rua@dmarc.brevo.com
The tag table helps users understand exactly which DMARC values are present in the DNS record.
🧠 Analysis Section
The Analysis section translates raw DMARC tags into practical configuration meaning.
Example:
Policy: none
Subdomain Policy: inherit
RUA: mailto:rua@dmarc.brevo.com
RUF: —
DKIM Alignment: r
SPF Alignment: r
Failure Options: 0
Coverage %: 100
This section is useful for both technical and non-technical review because it explains the active DMARC posture in a structured format.
✅ Configuration Checks
The tool performs several checks to evaluate DMARC health.
Example:
Check: record_exists
OK

Check: valid_version
OK

Check: policy_enabled
FAIL

Check: reporting_enabled
OK

Check: strict_alignment
FAIL
record_exists
Checks whether a DMARC record exists.
Example:
record_exists: OK
If this check fails, the domain does not have a detectable DMARC record.
valid_version
Checks whether the record uses a valid DMARC version tag.
Example:
valid_version: OK
A valid DMARC record should include:
v=DMARC1
policy_enabled
Checks whether the domain uses an enforcement policy.
Example:
policy_enabled: FAIL
This may fail when the policy is:
p=none
p=none is valid for monitoring, but it does not request quarantine or rejection of failing messages.
reporting_enabled
Checks whether DMARC reporting is configured.
Example:
reporting_enabled: OK
This usually means that rua is present.
Example:
rua=mailto:rua@dmarc.brevo.com
strict_alignment
Checks whether strict alignment is configured.
Example:
strict_alignment: FAIL
This may fail when both alignment tags use relaxed mode or default relaxed behavior:
adkim=r
aspf=r
Strict alignment is not always required, but it can improve protection for mature domains after legitimate senders are validated.
📊 Risk Score
The tool provides a risk score to help prioritize remediation.
Example:
Risk Score: 40 / 100
A lower score may indicate a weaker DMARC posture, while a higher score may indicate stronger protection.
The score may be influenced by:
-
whether a DMARC record exists;
-
whether the version is valid;
-
whether the domain uses
p=none,p=quarantine, orp=reject; -
whether aggregate reporting is enabled;
-
whether forensic reporting is configured;
-
whether strict alignment is enabled;
-
whether coverage is set to 100%;
-
whether subdomain policy is defined;
-
whether required tags are present.
Example interpretation:
| Score Range | General Meaning |
|---|---|
| 0–30 | Weak or missing DMARC protection |
| 31–60 | Basic monitoring or partial configuration |
| 61–80 | Good configuration with some improvement areas |
| 81–100 | Strong DMARC enforcement posture |
The score should be treated as a practical guidance indicator, not as the only measure of e-mail security.
📚 Reference by Tags
v — Version
Defines the DMARC protocol version.
Example:
v=DMARC1
This tag is required.
p — Domain Policy
Defines the policy for the main domain.
Example:
p=none
Possible values:
none
quarantine
reject
sp — Subdomain Policy
Defines the policy for subdomains.
Example:
sp=reject
If sp is not present, subdomains inherit the main p policy.
rua — Aggregate Reports
Defines addresses for aggregate DMARC reports.
Example:
rua=mailto:rua@example.com
Multiple report destinations may be separated by commas.
ruf — Forensic Reports
Defines addresses for forensic or failure reports.
Example:
ruf=mailto:forensic@example.com
Support for RUF varies across mail receivers.
pct — Policy Percentage
Defines what percentage of messages the policy applies to.
Example:
pct=100
If omitted, the default is 100.
fo — Failure Options
Defines reporting behavior for SPF and DKIM failures.
Example:
fo=0
Common values:
0
1
d
s
adkim — DKIM Alignment
Defines DKIM alignment strictness.
Example:
adkim=s
Possible values:
r
s
r means relaxed.s means strict.
aspf — SPF Alignment
Defines SPF alignment strictness.
Example:
aspf=s
Possible values:
r
s
r means relaxed.s means strict.
🧪 Example DMARC Configurations
Monitoring-Only DMARC
v=DMARC1; p=none; rua=mailto:dmarc-reports@example.com
Meaning:
-
DMARC exists.
-
Reports are enabled.
-
No enforcement is requested.
-
Good for initial monitoring.
-
Not strong enough for anti-spoofing enforcement.
Best for:
-
first deployment;
-
mail source discovery;
-
monitoring legitimate senders;
-
preparing for enforcement.
Quarantine Policy
v=DMARC1; p=quarantine; rua=mailto:dmarc-reports@example.com; pct=100
Meaning:
-
DMARC is enabled.
-
Failing messages should be treated as suspicious.
-
Aggregate reports are enabled.
-
Policy applies to 100% of messages.
Best for:
-
intermediate enforcement;
-
reducing spoofing risk;
-
phased rollout before rejection.
Reject Policy
v=DMARC1; p=reject; rua=mailto:dmarc-reports@example.com; pct=100
Meaning:
-
Strong DMARC enforcement is enabled.
-
Failing messages should be rejected.
-
Aggregate reports are enabled.
-
Policy applies to all messages.
Best for:
-
mature domains;
-
high-value brands;
-
anti-phishing protection;
-
domains with verified mail sources.
Strict Alignment Policy
v=DMARC1; p=reject; sp=reject; rua=mailto:dmarc-reports@example.com; adkim=s; aspf=s; pct=100
Meaning:
-
Strong enforcement for domain and subdomains.
-
Strict DKIM alignment.
-
Strict SPF alignment.
-
Aggregate reports enabled.
-
Full coverage.
Best for:
-
high-security domains;
-
mature e-mail infrastructure;
-
brands with high spoofing risk;
-
organizations with controlled sender inventory.
🧠 Recommended DMARC Deployment Workflow
A practical DMARC deployment workflow should be gradual.
1. Publish a Monitoring Policy
Start with:
v=DMARC1; p=none; rua=mailto:dmarc-reports@example.com
This allows the organization to collect reports without affecting mail delivery.
2. Analyze Reports
Review aggregate reports to identify all legitimate senders.
Check:
-
corporate mail provider;
-
marketing platforms;
-
CRM systems;
-
support systems;
-
transactional e-mail services;
-
billing systems;
-
cloud applications;
-
legacy mail servers;
-
third-party vendors.
3. Fix SPF and DKIM Alignment
Make sure legitimate senders pass SPF or DKIM alignment.
Review:
SPF pass and aligned
DKIM pass and aligned
Visible From domain
Return-Path domain
DKIM d= domain
4. Move to Quarantine
After monitoring, move to:
v=DMARC1; p=quarantine; rua=mailto:dmarc-reports@example.com; pct=100
Optionally start with a lower percentage:
pct=25
Then increase gradually.
5. Move to Reject
After confirming legitimate mail is aligned, move to:
v=DMARC1; p=reject; rua=mailto:dmarc-reports@example.com; pct=100
This gives stronger protection against spoofing.
6. Define Subdomain Policy
Add an explicit subdomain policy.
Example:
sp=reject
This helps protect unused or unmanaged subdomains.
7. Consider Strict Alignment
After confirming all senders are properly configured, consider:
adkim=s; aspf=s
Strict alignment should be tested carefully before production deployment.
🚨 Common DMARC Issues
Missing DMARC Record
The domain has no detectable DMARC TXT record.
Risk:
-
spoofing protection is weak;
-
no DMARC reports are received;
-
attackers can impersonate the domain more easily.
Recommended action:
Publish a DMARC record at _dmarc.domain with at least p=none and a valid rua address.
Policy Is Set to None
Example:
p=none
Risk:
-
reports may be collected;
-
failing mail is not quarantined or rejected;
-
spoofing protection is limited.
Recommended action:
After monitoring legitimate mail sources, move to p=quarantine or p=reject.
Reporting Is Not Enabled
Missing rua.
Risk:
-
no aggregate visibility;
-
difficult to identify legitimate senders;
-
difficult to safely move toward enforcement.
Recommended action:
Add rua=mailto:dmarc-reports@example.com or use a trusted DMARC reporting provider.
Subdomain Policy Not Defined
Missing sp.
Risk:
-
subdomains inherit the main policy;
-
weak root policy may also weaken subdomain protection;
-
attackers may abuse unused subdomains.
Recommended action:
Define sp=quarantine or sp=reject after reviewing legitimate subdomain mail usage.
Relaxed Alignment
Example:
adkim=r
aspf=r
Risk:
-
relaxed alignment is easier to operate;
-
strict identity matching is not enforced;
-
some spoofing scenarios may be harder to restrict.
Recommended action:
Consider strict alignment only after all legitimate senders are validated.
Low Policy Coverage
Example:
pct=25
Risk:
-
only part of failing mail is affected by the enforcement policy;
-
spoofing protection is partial.
Recommended action:
Gradually increase pct to 100 after validating mail delivery.
🔎 Common Use Cases
Domain Anti-Spoofing Review
Check whether a domain is protected against spoofed e-mail.
Phishing Defense
Evaluate whether attackers can easily send unauthenticated mail using the domain in the visible From address.
Brand Protection
Review DMARC enforcement for high-value brand domains and customer-facing domains.
SOC Triage
Quickly check DMARC posture during phishing investigations.
Mail Security Audit
Review policy, reporting, SPF alignment, DKIM alignment, and subdomain behavior.
Compliance Documentation
Document whether e-mail authentication controls are deployed.
Vendor Mail Review
Confirm whether third-party senders are included in SPF and DKIM alignment before enforcement.
Migration Monitoring
Monitor DMARC reports when moving mail providers or adding new sending services.
Subdomain Protection Review
Check whether subdomain policy is inherited or explicitly enforced.
Risk Prioritization
Use the risk score and checks to prioritize remediation.
🧾 Recommended Reporting Format
When documenting a DMARC check, use a consistent format.
Example:
Domain: niamonx.com
Check time: 23:04:59
DMARC Status:
Record exists: OK
Valid version: OK
Policy enabled: FAIL
Reporting enabled: OK
Strict alignment: FAIL
Policy:
p=none
sp=inherits p
pct=100 implicit
fo=0 default
adkim=r default
aspf=r default
Reports:
RUA: mailto:rua@dmarc.brevo.com
RUF: —
Risk Score:
40 / 100
Parsed tags:
v=DMARC1
p=none
rua=mailto:rua@dmarc.brevo.com
Recommended remediation note:
The domain has a valid DMARC record with aggregate reporting enabled, but the policy is set to p=none. This is suitable for monitoring, but it does not enforce protection against spoofed messages. After reviewing reports and confirming legitimate senders, move gradually to p=quarantine and then p=reject.
🛡️ Security, Privacy & Responsible Use
DMARC Policy & Configuration is intended for lawful e-mail security analysis, domain protection, compliance, anti-phishing review, and defensive cybersecurity workflows.
Acceptable use cases include:
-
checking your own domains;
-
auditing customer domains with authorization;
-
reviewing anti-spoofing posture;
-
preparing DMARC deployment;
-
monitoring mail authentication readiness;
-
supporting phishing investigations;
-
documenting compliance controls;
-
reviewing brand protection risks;
-
validating mail provider migrations;
-
checking subdomain policy inheritance.
Users should follow responsible use principles:
-
Do not assume a weak DMARC policy proves compromise.
-
Do not use DMARC results alone for attribution.
-
Validate findings with SPF, DKIM, DNS, and mail-flow evidence.
-
Review aggregate reports before moving to enforcement.
-
Coordinate changes with mail administrators and vendors.
-
Avoid publishing strict policies without testing legitimate senders.
-
Store reports securely because DMARC reports may reveal mail infrastructure.
-
Use authorized workflows when checking third-party domains.
DMARC is a powerful control, but incorrect enforcement can disrupt legitimate mail delivery.
🚦 Server Errors and Retry Behavior
In some cases, the system may return a server-side error.
Interface note:
If you receive a 500 error from the database, repeat your request several times.
Temporary errors may be caused by:
-
database processing issues;
-
DNS lookup failure;
-
network timeout;
-
upstream resolver issue;
-
temporary backend error;
-
malformed or unusual DNS response.
If the error persists, repeat the query later and compare results with raw DNS tools or another validation method.
📊 Interpreting Results Correctly
DMARC results should be interpreted carefully.
Important notes:
-
p=noneis valid but monitoring-only. -
p=quarantineprovides partial enforcement. -
p=rejectprovides the strongest enforcement. -
ruaenables aggregate visibility. -
Missing
ruamakes monitoring harder. -
Missing
spmeans subdomains inherit the main policy. -
pct=100may be implicit even if not written in the record. -
adkim=randaspf=rare relaxed defaults. -
Strict alignment can improve security but may break legitimate mail if deployed too early.
-
DMARC depends on SPF and DKIM alignment.
-
DMARC does not replace SPF or DKIM.
-
DMARC does not stop all phishing, especially lookalike domains.
-
DMARC protects the visible From domain from direct spoofing.
-
Enforcement should be deployed gradually after monitoring.
A strong e-mail security posture normally includes SPF, DKIM, DMARC, secure DNS, monitored reports, vendor governance, and domain abuse monitoring.
⚙️ Technical Highlights
-
DMARC policy analysis tool
-
Available at
dash.niamonx.io/dmarc_check -
Checks
_dmarc.domain -
Supports second-level domains and subdomains
-
Accepts domains without protocol
-
Parses DMARC TXT records
-
Supports RFC 7489-style DMARC analysis
-
Parses
v,p,sp,rua,ruf,pct,fo,adkim, andaspf -
Displays active policy level
-
Highlights
none,quarantine, andreject -
Shows aggregate report URIs
-
Shows forensic report URIs
-
Displays DKIM alignment mode
-
Displays SPF alignment mode
-
Shows failure reporting options
-
Shows policy coverage percentage
-
Performs record existence check
-
Performs version validation check
-
Performs policy enforcement check
-
Performs reporting check
-
Performs strict alignment check
-
Calculates risk score
-
Displays parsed tag table
-
Shows analysis messages
-
Supports domain history in LocalStorage
-
Supports copying and exporting
-
Suitable for e-mail security audits, anti-phishing defense, SOC workflows, compliance, and brand protection
📌 Usage Hints
-
Enter only the domain, such as
example.com. -
Do not include
https://orhttp://. -
Do not enter
_dmarc.example.com; enterexample.com. -
Start by checking whether the record exists.
-
Confirm that
v=DMARC1is present. -
Review the active
ppolicy. -
Treat
p=noneas monitoring-only. -
Use
ruato collect aggregate reports. -
Review whether
spis explicitly configured. -
Check whether
pctis 100. -
Review
adkimandaspfalignment modes. -
Move gradually from
p=nonetop=quarantineand thenp=reject. -
Validate legitimate senders before enforcing rejection.
-
Use the risk score to prioritize improvements.
-
Export results for compliance and audit documentation.
-
Repeat the request several times if a temporary 500 error occurs.
-
Combine DMARC analysis with SPF, DKIM, DNS, and mail-flow review.
📬 Contact Information
For technical, legal, abuse, privacy, or support-related inquiries, users can contact the NiamonX team directly:
support@niamonx.io — Technical Support
other@niamonx.io — General Inquiries
takedown@niamonx.io — Privacy or Data Removal Requests
legal@niamonx.io — Legal and Compliance Matters
Alternative contact channel:
🔗 Helpdesk: https://support.niamonx.io/
Summary
NiamonX DMARC Policy & Configuration is a DMARC analysis tool for checking e-mail domain protection. It extracts the DMARC record from _dmarc.domain, parses tags such as v, p, sp, rua, ruf, pct, fo, adkim, and aspf, displays policy level, reporting configuration, alignment settings, analysis checks, and risk score.
The tool is designed for anti-phishing defense, brand protection, SOC triage, compliance review, domain security auditing, mail provider migration, and DMARC deployment planning. A domain with p=none can collect reports, but stronger protection normally requires a phased move to p=quarantine or p=reject after monitoring legitimate mail sources and confirming SPF / DKIM alignment.
PageRank | Open PageRank Domain Ranking Tool
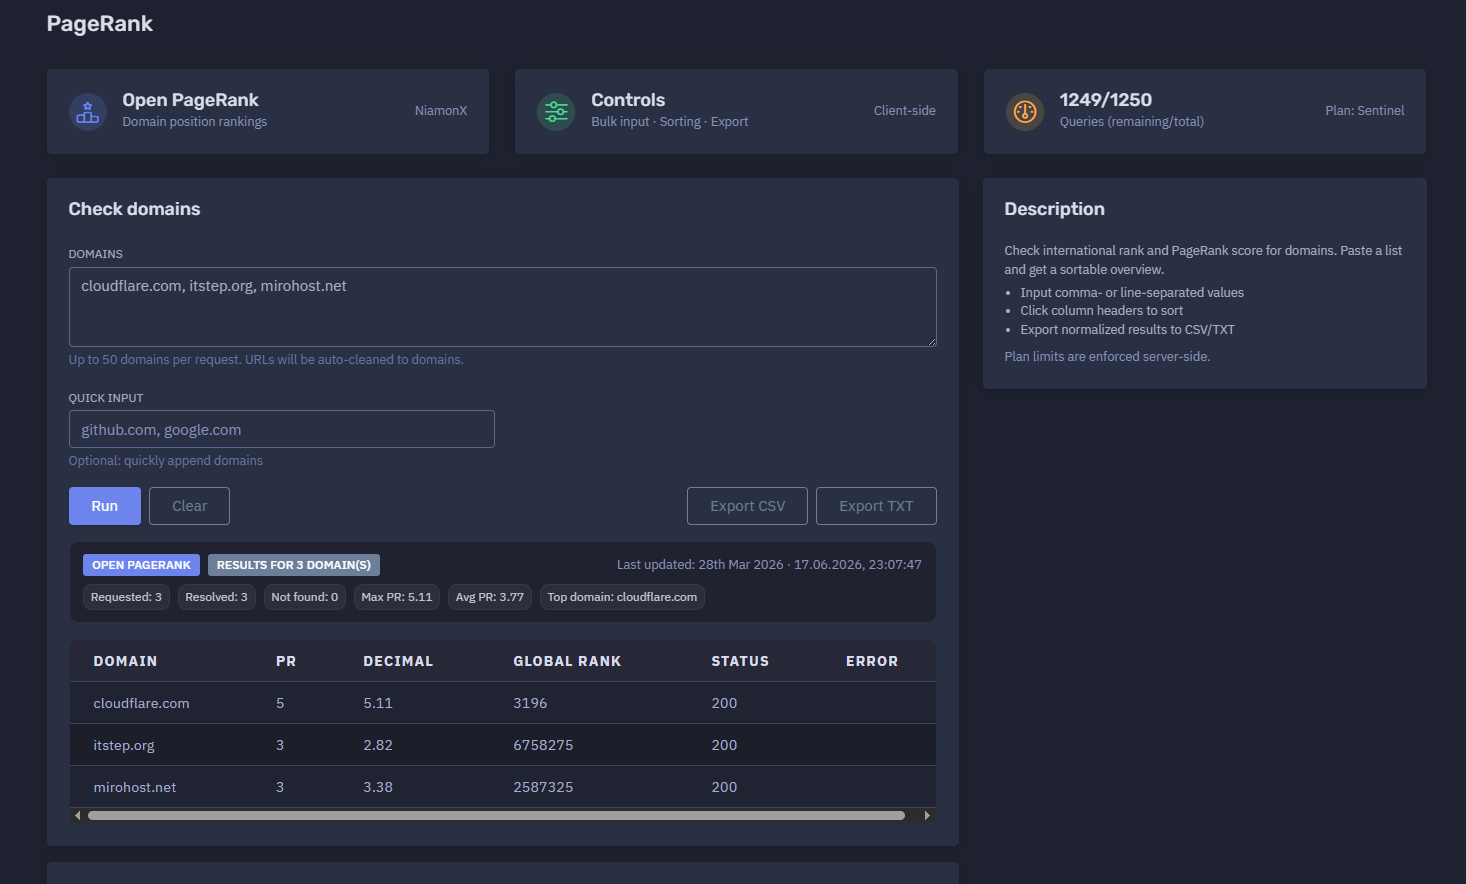
The platform available at https://dash.niamonx.io/pagerank — known as PageRank — is a domain ranking and Open PageRank lookup tool within the NiamonX platform. It allows users to check international ranking metrics, PageRank score, ranking position, availability status, and comparative authority signals for one or multiple domains.
The tool supports bulk domain input, automatic URL cleanup, quick input presets, sortable result tables, export options, request history, and plan-based query limits.
Overview of the Service
PageRank is designed to help users evaluate the relative authority and ranking position of domains using Open PageRank-style metrics. It provides a fast way to compare multiple domains and understand which domain has stronger ranking signals.
The tool is useful for:
-
SEO analysis
-
OSINT research
-
domain reputation review
-
competitive analysis
-
backlink and authority research
-
marketing research
-
brand protection
-
domain portfolio review
-
threat intelligence enrichment
-
website credibility checks
-
investigation reports
-
content and publishing strategy
-
technical due diligence
Users can paste a list of domains, run a lookup, and receive a sortable overview containing rank, PageRank score, position, and response status for each domain.
Example input:
cloudflare.com, itstep.org, mirohost.net
Example summary:
Results for 3 domain(s)
Last updated: 28th Mar 2026 · 17.06.2026, 23:07:47
Requested: 3
Resolved: 3
Not found: 0
Max PR: 5.11
Avg PR: 3.77
Top domain: cloudflare.com
🔍 How the Tool Works
The user enters one or more domains into the input field. The tool normalizes the submitted values, removes URL formatting when needed, sends the cleaned domain list for ranking lookup, and displays the results in a table.
The tool can process:
-
comma-separated domains;
-
line-separated domains;
-
copied domain lists;
-
URLs that can be cleaned to domains;
-
quick input values appended to the main list.
Example input:
cloudflare.com, itstep.org, mirohost.net
Example normalized domains:
cloudflare.com
itstep.org
mirohost.net
Example result table:
cloudflare.com 5 5.11 3196 200
itstep.org 3 2.82 6758275 200
mirohost.net 3 3.38 2587325 200
The result allows users to compare ranking strength and authority signals across domains.
🧩 Supported Input
PageRank supports domain-based input.
Valid examples:
cloudflare.com
itstep.org
mirohost.net
github.com, google.com
Line-separated input is also supported:
cloudflare.com
itstep.org
mirohost.net
URLs may be automatically cleaned to domains.
Example submitted URL:
https://www.cloudflare.com/products/
Possible normalized domain:
cloudflare.com
Unsupported or poor input examples:
not a domain
user@example.com
localhost
192.168.1.1
https://
Recommended input format:
domain.com
or:
domain1.com, domain2.org, domain3.net
⚙️ Main Function: Check Domains
The main panel allows users to submit domains for PageRank lookup.
Example:
Check domains
Domains:
cloudflare.com, itstep.org, mirohost.net
The tool supports up to 50 domains per request.
Interface note:
Up to 50 domains per request. URLs will be auto-cleaned to domains.
This makes the tool suitable for quick comparisons, bulk checks, and domain list analysis.
⚡ Quick Input
The Quick Input field allows users to quickly append domains to the main input.
Example:
github.com, google.com
Interface note:
Optional: quickly append domains
Quick input is useful when users already have a main list but want to add commonly checked domains or comparison benchmarks without rewriting the entire input.
Example workflow:
Main input:
cloudflare.com, itstep.org, mirohost.net
Quick input:
github.com, google.com
Final checked set:
cloudflare.com, itstep.org, mirohost.net, github.com, google.com
🚦 Plan Limits and Usage
PageRank uses plan-based query limits.
Example:
1249 / 1250
Queries remaining / total
Plan: Sentinel
Important points:
-
Server-side plan limits are enforced.
-
Each request may consume plan quota.
-
Bulk requests may count according to platform rules.
-
Up to 50 domains can be submitted per request.
-
If plan limits are exceeded, new requests may be blocked.
-
Previous results may remain visible after a failed request.
-
Users should monitor remaining queries when running repeated checks.
Interface note:
Plan limits are enforced server-side.
📊 Results Summary
After a successful lookup, PageRank displays a result summary.
Example:
Results for 3 domain(s)
Last updated: 28th Mar 2026 · 17.06.2026, 23:07:47
Requested: 3
Resolved: 3
Not found: 0
Max PR: 5.11
Avg PR: 3.77
Top domain: cloudflare.com
Typical summary fields include:
| Field | Description |
|---|---|
| Results for | Number of domains included in the displayed result |
| Last updated | Date of the ranking dataset or source update |
| Requested | Number of submitted domains |
| Resolved | Number of domains successfully found or processed |
| Not found | Number of domains without available ranking data |
| Max PR | Highest PageRank score in the result set |
| Avg PR | Average PageRank score across resolved domains |
| Top domain | Domain with the highest PageRank score in the submitted set |
The summary helps users quickly understand the overall strength of the checked domain group.
🧾 Results Table
The results table displays ranking data for each domain.
Example:
cloudflare.com 5 5.11 3196 200
itstep.org 3 2.82 6758275 200
mirohost.net 3 3.38 2587325 200
A typical table may include:
| Column | Description |
|---|---|
| Domain | Checked domain |
| Rank | Rounded or categorized PageRank value |
| PageRank Score | More precise PageRank score |
| Position | International ranking position |
| Status | HTTP or API response status |
Example interpretation:
cloudflare.com
Rank: 5
PageRank Score: 5.11
Position: 3196
Status: 200
This means the domain was found, returned successfully, and has the strongest PageRank score among the checked examples.
🏷️ Domain Column
The Domain column shows the normalized domain checked by the tool.
Example:
cloudflare.com
The tool may clean URLs and reduce them to domains before lookup.
Example:
Input: https://www.cloudflare.com/products/
Normalized: cloudflare.com
This helps users paste mixed URL lists without manually cleaning each entry.
📈 Rank Column
The Rank column shows a simplified PageRank value.
Example:
Rank: 5
This value provides a quick category-like view of domain authority.
A higher value generally indicates stronger ranking authority or broader visibility in the ranking dataset.
Example comparison:
cloudflare.com → Rank 5
itstep.org → Rank 3
mirohost.net → Rank 3
In this example, cloudflare.com has a stronger rank than the other two domains.
📊 PageRank Score
The PageRank Score column shows a more precise score.
Example:
PageRank Score: 5.11
This score allows more detailed comparison than the rounded rank.
Example:
itstep.org: 2.82
mirohost.net: 3.38
Although both domains may have Rank 3, the PageRank score shows that mirohost.net has a higher score than itstep.org in this result set.
🌍 Position Ranking
The Position column shows the domain’s international ranking position.
Example:
Position: 3196
A lower position number generally indicates a stronger or more prominent domain in the ranking dataset.
Example comparison:
cloudflare.com → 3196
mirohost.net → 2587325
itstep.org → 6758275
In this example, cloudflare.com has a significantly stronger international position.
Position rankings are useful for:
-
competitive comparison;
-
domain authority review;
-
SEO research;
-
domain reputation analysis;
-
prioritizing investigation targets;
-
comparing partner or vendor domains;
-
evaluating digital footprint strength.
✅ Status Column
The Status column shows the response status for each checked domain.
Example:
Status: 200
A status of 200 usually indicates that the ranking lookup completed successfully for that domain.
Possible status meanings may include:
| Status | General Meaning |
|---|---|
| 200 | Successfully resolved or returned |
| 404 | Domain not found in the ranking dataset |
| 400 | Invalid or malformed request |
| 429 | Rate limit or quota issue |
| 500 | Server-side processing error |
Exact status behavior depends on backend implementation and upstream source responses.
🔃 Sorting Results
The table supports sorting by column headers.
Interface note:
Click column headers to sort
Sorting helps users quickly identify:
-
highest PageRank score;
-
lowest PageRank score;
-
best international ranking position;
-
domains that were not found;
-
domains with successful or failed status;
-
strongest domains in a bulk list;
-
weakest domains in a comparison set.
Recommended sorting workflows:
| Goal | Sort By |
|---|---|
| Find strongest domain | PageRank Score descending |
| Find weakest domain | PageRank Score ascending |
| Find best international rank | Position ascending |
| Find missing domains | Status or Not Found |
| Compare bulk list | PageRank Score descending |
| Identify outliers | Position or PR score |
📤 Export Options
PageRank supports exporting normalized results.
Interface note:
Export normalized results to CSV/TXT
Export options are useful for:
-
SEO reports;
-
competitor analysis;
-
domain portfolio review;
-
spreadsheet analysis;
-
client reports;
-
OSINT case notes;
-
brand protection documentation;
-
threat intelligence enrichment;
-
compliance evidence;
-
historical comparison.
📄 CSV Export
CSV export is useful when users want to analyze results in spreadsheet tools.
Example CSV-style output:
Domain,Rank,PageRank Score,Position,Status
cloudflare.com,5,5.11,3196,200
itstep.org,3,2.82,6758275,200
mirohost.net,3,3.38,2587325,200
CSV is recommended for:
-
Excel or Google Sheets;
-
reporting dashboards;
-
ranking comparison;
-
data enrichment;
-
client deliverables;
-
domain portfolio analysis.
📄 TXT Export
TXT export is useful for simple lists or plain-text reports.
Example TXT-style output:
cloudflare.com | Rank: 5 | PR: 5.11 | Position: 3196 | Status: 200
itstep.org | Rank: 3 | PR: 2.82 | Position: 6758275 | Status: 200
mirohost.net | Rank: 3 | PR: 3.38 | Position: 2587325 | Status: 200
TXT export is useful for:
-
quick notes;
-
internal documentation;
-
chat sharing;
-
case summaries;
-
Markdown reports;
-
simple evidence logs.
🕓 Request History
PageRank stores recent requests locally in the browser.
Example interface note:
Request History
Filter...
Stores last 100 requests in your browser.
Example history entry:
cloudflare.com, itstep.org, mirohost.net
Count: 3
17.06.2026, 23:07:47
The history helps users:
-
repeat previous checks;
-
review recent domain lists;
-
compare past requests;
-
continue research sessions;
-
filter old lookups;
-
preserve local workflow context.
Because request history is stored in the browser, it may be deleted when browser data is cleared or when the user changes devices, profiles, or private browsing sessions.
🧠 Understanding PageRank Metrics
PageRank-style metrics are designed to estimate the relative importance, authority, or ranking strength of a domain.
A higher PageRank score may indicate that the domain has stronger web visibility, authority signals, or link-based importance in the ranking dataset.
However, PageRank should be interpreted carefully.
Important notes:
-
PageRank is not the same as traffic.
-
PageRank is not a guarantee of trustworthiness.
-
A high score does not mean a domain is safe.
-
A low score does not automatically mean a domain is malicious.
-
Ranking data may be updated periodically.
-
Some domains may not be found in the dataset.
-
Scores should be compared within context.
-
Domain authority can change over time.
-
Different ranking providers may produce different values.
PageRank is best used as one signal among many.
🔎 Common Use Cases
SEO Research
Compare domain authority signals across competitors, partners, publishers, or content targets.
Competitive Analysis
Check which domains in a group have stronger ranking positions and higher PageRank scores.
OSINT Research
Enrich domain investigations with authority and ranking context.
Domain Reputation Review
Evaluate whether a domain appears to have established web presence or limited visibility.
Brand Protection
Compare suspicious domains, impersonation domains, or lookalike domains against legitimate brand domains.
Threat Intelligence Enrichment
Add ranking context to domains found in phishing kits, malware infrastructure, spam campaigns, or suspicious web activity.
Partner and Vendor Review
Check public ranking strength of vendor, partner, or customer-facing domains.
Domain Portfolio Analysis
Compare multiple owned domains to identify stronger and weaker assets.
Content Outreach
Evaluate domains before outreach, publication, partnership, or backlink analysis.
Investigation Prioritization
Use PageRank and position data to prioritize domains that may have broader reach or visibility.
🧪 Example Analysis
Example checked domains:
cloudflare.com, itstep.org, mirohost.net
Example results:
cloudflare.com
Rank: 5
PR: 5.11
Position: 3196
Status: 200
itstep.org
Rank: 3
PR: 2.82
Position: 6758275
Status: 200
mirohost.net
Rank: 3
PR: 3.38
Position: 2587325
Status: 200
Example interpretation:
cloudflare.com has the strongest PageRank score and best international position in this set. mirohost.net has a higher PageRank score and better position than itstep.org, even though both have the same rounded rank value. All three domains were resolved successfully with status 200.
🧠 Recommended Workflow
A practical PageRank workflow should follow these steps.
1. Prepare a Domain List
Collect domains that need to be compared.
Example:
cloudflare.com
itstep.org
mirohost.net
The list may be comma-separated or line-separated.
2. Paste Domains Into the Tool
Use the Domains field.
Example:
cloudflare.com, itstep.org, mirohost.net
Do not worry if some values are full URLs. The tool can auto-clean URLs to domains.
3. Add Quick Input if Needed
Use Quick Input for optional additional domains.
Example:
github.com, google.com
4. Run Open PageRank
Start the lookup.
Example:
Open PageRank
The tool will process the normalized domains and return ranking data.
5. Review the Summary
Check the overall result metrics.
Example:
Requested: 3
Resolved: 3
Not found: 0
Max PR: 5.11
Avg PR: 3.77
Top domain: cloudflare.com
6. Sort the Table
Click column headers to sort by PageRank score, position, status, or domain.
Recommended first sort:
PageRank Score descending
This quickly shows the strongest domains in the list.
7. Review Not Found Results
If any domains are not found, validate that the input is correct.
Possible reasons:
-
typo in domain;
-
newly created domain;
-
low-visibility domain;
-
domain missing from dataset;
-
invalid input;
-
unsupported domain format.
8. Export Results
Export normalized data to CSV or TXT for reporting.
Recommended exports:
CSV for spreadsheet analysis
TXT for quick documentation
9. Compare With Other Signals
Use PageRank as one signal and enrich with additional checks.
Recommended follow-up analysis:
-
DNS records;
-
WHOIS / RDAP;
-
SSL / TLS certificate data;
-
HTTP status;
-
website screenshot;
-
malware or phishing reputation;
-
backlink profile;
-
traffic estimates;
-
content quality;
-
domain age;
-
passive DNS;
-
threat intelligence feeds.
📊 Interpreting Results Correctly
PageRank results should be interpreted as comparative ranking intelligence, not as a final verdict.
Important interpretation notes:
-
Higher PageRank suggests stronger authority signals.
-
Lower position number usually means stronger global ranking.
-
A domain with a high PageRank can still be compromised.
-
A domain with a low PageRank can still be legitimate.
-
Newly registered domains may have no ranking data.
-
Parked or inactive domains may be ranked inconsistently.
-
Domains behind redirects may still normalize correctly.
-
URL cleanup may remove paths and focus only on the domain.
-
Ranking data may reflect the last dataset update date.
-
Scores may change between updates.
-
PageRank is not a security rating by itself.
-
Use additional technical checks before drawing conclusions.
Example:
A high PageRank score can indicate domain authority, but it does not prove that the current website content is safe or trustworthy.
🚨 Security Review Checklist
When using PageRank in security or OSINT workflows, review the following areas.
High-Ranking Suspicious Domains
A suspicious domain with a high PageRank may deserve priority review because it may have broader visibility or inherited authority.
Check:
-
current website content;
-
redirects;
-
ownership;
-
DNS records;
-
certificate history;
-
passive DNS;
-
compromise indicators;
-
malware reputation.
Low-Ranking Lookalike Domains
A low-ranking domain that resembles a brand may still be dangerous.
Check for:
-
typosquatting;
-
phishing pages;
-
fake login portals;
-
brand impersonation;
-
malicious redirects;
-
recently registered infrastructure.
Not Found Domains
Domains not found in ranking data may be:
-
newly registered;
-
low visibility;
-
inactive;
-
typo domains;
-
internal-only names;
-
suspicious disposable domains.
Not found does not mean safe.
Large Domain Lists
For bulk lists, sort by PageRank score and position to prioritize review.
Recommended triage:
1. High PageRank + suspicious context
2. Low PageRank + brand similarity
3. Not found + recent registration
4. Unexpected domains in known infrastructure
📈 Recommended Reporting Format
When documenting PageRank checks, use a consistent format.
Example:
Checked domains:
cloudflare.com, itstep.org, mirohost.net
Check time:
17.06.2026, 23:07:47
Dataset last updated:
28th Mar 2026
Summary:
Requested: 3
Resolved: 3
Not found: 0
Max PR: 5.11
Avg PR: 3.77
Top domain: cloudflare.com
Results:
1. cloudflare.com | Rank: 5 | PR: 5.11 | Position: 3196 | Status: 200
2. mirohost.net | Rank: 3 | PR: 3.38 | Position: 2587325 | Status: 200
3. itstep.org | Rank: 3 | PR: 2.82 | Position: 6758275 | Status: 200
Example analyst note:
Observation:
cloudflare.com has the highest PageRank score and strongest international ranking position in the checked set. mirohost.net ranks higher than itstep.org based on both PageRank score and position. All submitted domains were successfully resolved.
🛡️ Security, Privacy & Responsible Use
PageRank is intended for lawful domain analysis, SEO research, OSINT, reputation review, brand protection, compliance, and defensive cybersecurity workflows.
Acceptable use cases include:
-
checking your own domains;
-
comparing competitor domains;
-
reviewing domain reputation signals;
-
enriching investigation reports;
-
analyzing suspicious domains;
-
reviewing domain portfolios;
-
supporting brand protection;
-
performing authorized OSINT research;
-
preparing SEO or marketing analysis;
-
documenting domain authority context.
Users should follow responsible use principles:
-
Do not treat PageRank as proof of safety.
-
Do not treat low ranking as proof of maliciousness.
-
Do not use ranking data alone for attribution.
-
Validate security conclusions with technical evidence.
-
Respect authorization boundaries when investigating third-party domains.
-
Store exported domain lists securely when they involve customers or investigations.
-
Use ranking data as one supporting signal, not as a final decision.
⚙️ Technical Highlights
-
Open PageRank domain ranking tool
-
Available at
dash.niamonx.io/pagerank -
Checks international rank and PageRank score
-
Supports bulk domain input
-
Accepts comma-separated values
-
Accepts line-separated values
-
Supports up to 50 domains per request
-
Automatically cleans URLs to domains
-
Includes Quick Input for appending domains
-
Shows result dataset update date
-
Displays requested domain count
-
Displays resolved domain count
-
Displays not found count
-
Calculates maximum PageRank score
-
Calculates average PageRank score
-
Identifies top domain
-
Displays domain rank
-
Displays precise PageRank score
-
Displays international position
-
Displays status code
-
Supports sortable columns
-
Supports CSV export
-
Supports TXT export
-
Stores local request history
-
Keeps last 100 requests in the browser
-
Supports history filtering
-
Uses server-side plan limits
-
Suitable for SEO, OSINT, domain reputation review, brand protection, competitive analysis, and threat intelligence enrichment
📌 Usage Hints
-
Paste domains separated by commas or new lines.
-
You can submit up to 50 domains per request.
-
URLs are automatically cleaned to domains.
-
Use Quick Input to append common comparison domains.
-
Sort by PageRank score to find the strongest domains.
-
Sort by position to compare international ranking.
-
Check Not Found results for typos or low-visibility domains.
-
Export CSV for spreadsheet analysis.
-
Export TXT for quick notes or reports.
-
Use request history to repeat previous checks.
-
Monitor remaining plan queries.
-
Remember that plan limits are enforced server-side.
-
Treat PageRank as one signal, not a complete reputation score.
-
Combine results with WHOIS, DNS, TLS, HTTP, screenshot, and threat intelligence checks.
-
Clear local history on shared devices when checking sensitive domain lists.
📬 Contact Information
For technical, legal, abuse, privacy, or support-related inquiries, users can contact the NiamonX team directly:
support@niamonx.io — Technical Support
other@niamonx.io — General Inquiries
takedown@niamonx.io — Privacy or Data Removal Requests
legal@niamonx.io — Legal and Compliance Matters
Alternative contact channel:
🔗 Helpdesk: https://support.niamonx.io/
Summary
NiamonX PageRank is an Open PageRank domain ranking tool for checking PageRank score, domain rank, international position, response status, and comparative authority metrics. It supports bulk input, automatic URL cleanup, quick input, sortable results, CSV/TXT export, local request history, and server-side plan limits.
The tool is designed for SEO research, OSINT analysis, competitive comparison, domain reputation review, brand protection, threat intelligence enrichment, domain portfolio analysis, and reporting workflows. PageRank results should be treated as ranking and authority signals, not as final security or trust decisions, and should be combined with DNS, WHOIS, TLS, HTTP, screenshot, backlink, traffic, and threat intelligence data for deeper analysis.