Networks and WiFi
Networks and WiFi
- Wifi Map & Data Search | WiFi Hotspot Intelligence
- IP Intelligence Search | Global IP Lookup
- IP Calculator | IPv4 Subnet, Converter & Network Toolkit
- IP / Domain Explorer | IP and Domain Geolocation & Network Intelligence
- GlobeLine Ping | High-Level IP Availability & RTT Check
- GeoPing | Multi-Location IP Availability & Latency Check
- GlobeLine DNS | DNS Query & Record Intelligence
- GeoDNS | Geographic DNS Response Intelligence
- DNS Resolver / Reverse | Forward and Reverse DNS Resolution
- Reverse IP Lookup | Passive Reverse IP Domain Intelligence
- ASN Information | Autonomous System Intelligence
Wifi Map & Data Search | WiFi Hotspot Intelligence
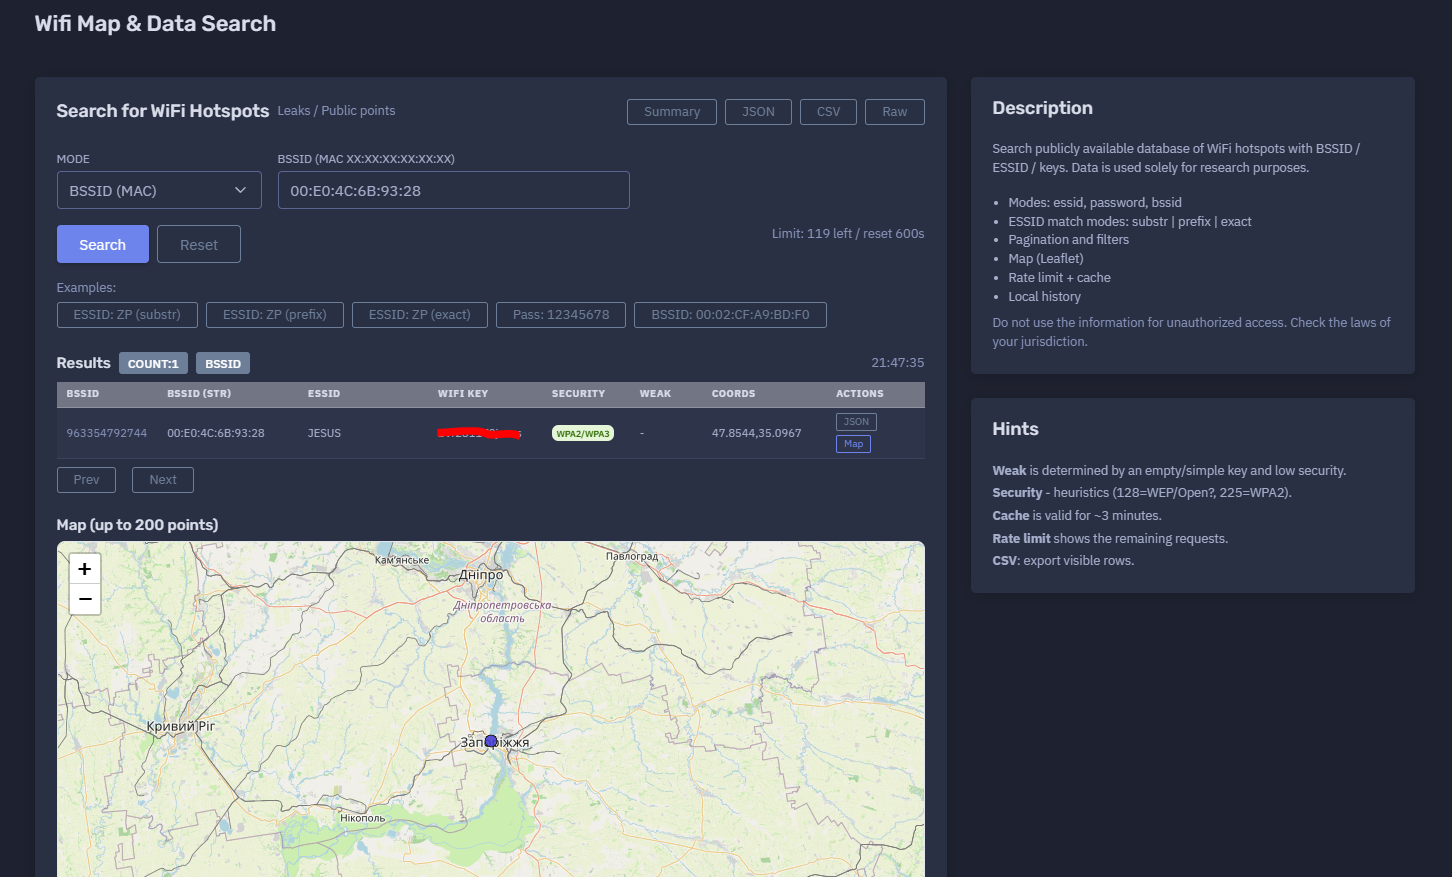
The platform available at https://dash.niamonx.io/wifi_data — known as Wifi Map & Data Search — is a WiFi hotspot intelligence and research tool within the NiamonX platform. It allows authorized users to search publicly available WiFi hotspot datasets by BSSID, ESSID, or WiFi key indicators and visualize matching access points on an interactive map.
Overview of the Service
Wifi Map & Data Search is designed for research, security analysis, wireless exposure review, and OSINT-style investigation of publicly available WiFi hotspot records.
The tool allows users to search known hotspot data using several search modes, including BSSID, ESSID, and WiFi key. Results may include network identifiers, security type, weak-key indicators, approximate coordinates, and map visualization.
The service is intended strictly for lawful research, defensive security, infrastructure audit, and awareness purposes. It must not be used to access networks without authorization.
WiFi data can be sensitive because it may include network names, access point identifiers, approximate locations, and historical credential-like values. Users must handle results responsibly and comply with local laws.
🔍 How the Search Works
When a user enters a query, the system searches a publicly available WiFi hotspot dataset using the selected mode.
Supported search modes include:
-
BSSID search
-
ESSID search
-
WiFi key search
The backend returns matching records, and the interface displays them in a structured results table. If coordinates are available, matching points can also be shown on a Leaflet map powered by OpenStreetMap.
The system supports rate limiting and short-term caching. Cache is typically valid for a few minutes, which helps reduce repeated backend requests for identical queries.
Example search flow:
-
Select a search mode.
-
Enter a BSSID, ESSID, or WiFi key indicator.
-
Submit the query.
-
Review matching hotspot records.
-
Check security type and weak-key indicators.
-
View approximate location on the map when coordinates are available.
-
Export visible rows when needed.
-
Use results only for lawful and authorized research.
🧩 What Can Be Searched
Wifi Map & Data Search supports several query types.
BSSID
BSSID is the MAC address of a wireless access point.
Example format:
00:11:22:33:44:55
BSSID search is useful when the analyst has a known access point identifier and wants to check whether it appears in the dataset.
ESSID
ESSID is the public WiFi network name, often shown as the visible WiFi name on devices.
Example:
Office_WiFi
ESSID searches may support different match modes:
-
substr -
prefix -
exact
This allows users to search for networks by full name, prefix, or partial string.
WiFi Key
WiFi key search allows checking whether a specific known key value appears in the dataset.
This mode should be used carefully and only for defensive or authorized research, such as verifying whether a weak or reused test password appears in public data.
Sensitive keys should be masked in documentation, reports, screenshots, and exports.
Example masked format:
********
⚙️ Search Modes
The tool supports multiple modes depending on the type of value being searched.
| Mode | Description |
|---|---|
bssid |
Search by access point MAC address |
essid |
Search by WiFi network name |
wifikey / password |
Search by WiFi key indicator |
Depending on the interface version, the WiFi key mode may be shown as password, wifikey, or similar internal naming.
🔎 ESSID Match Modes
ESSID search can use different matching modes.
| Match Mode | Description |
|---|---|
substr |
Finds ESSIDs containing the entered text |
prefix |
Finds ESSIDs starting with the entered text |
exact |
Finds only exact ESSID matches |
Examples:
substr: finds "Office_WiFi_Main" when searching "WiFi"
prefix: finds "Office_5G" when searching "Office"
exact: finds only "Office_WiFi"
Using exact mode reduces noise. Substring mode is useful for broad discovery but may return unrelated results.
📊 Results Table
After a successful search, matching records are shown in a structured table.
Typical columns include:
| Column | Description |
|---|---|
| BSSID | Numeric or internal BSSID representation |
| BSSID string | Standard MAC address format |
| ESSID | WiFi network name |
| WiFi Key | Key value, if present and permitted |
| Security | Detected or inferred security type |
| Weak | Weak-key or weak-security indicator |
| Coords | Latitude and longitude, if available |
| Actions | Available record actions |
Sensitive fields such as WiFi keys should be masked when screenshots, reports, or documentation are shared.
Example safe display format:
BSSID: 00:11:22:33:44:55
ESSID: Example_Network
WiFi Key: ********
Security: WPA2/WPA3
Coords: 47.0000, 35.0000
🗺️ Map View
The tool includes a map view for records with coordinates.
The map is based on Leaflet and OpenStreetMap.
The interface may display up to a limited number of points, for example:
Map: up to 200 points
The map helps users visually understand the geographic distribution of matching access points.
Map use cases:
-
Reviewing hotspot concentration
-
Checking approximate network location
-
Validating whether a BSSID appears in an expected area
-
Identifying exposed or outdated records
-
Supporting wireless infrastructure audits
Coordinates should be treated as sensitive. They may represent approximate or historical locations and should not be used for harassment, trespassing, or unauthorized access.
🧠 Key Features
Public WiFi Dataset Search
The tool searches publicly available WiFi hotspot records for research and analysis.
BSSID Lookup
Users can search for a specific access point MAC address.
ESSID Lookup
Users can search by network name with substring, prefix, or exact matching.
WiFi Key Indicator Search
Users can check whether known key values appear in the dataset for authorized security review.
Security Heuristics
The tool displays inferred security information such as WPA2, WPA3, WEP, or open-network indicators when available.
Weak Indicator
The system may mark a record as weak when the key is empty, simple, reused, or when the detected security configuration appears low-security.
Coordinates
Records may include latitude and longitude.
Leaflet Map
Matching records with coordinates can be visualized on an interactive map.
Rate Limit
The interface shows remaining requests and reset timing.
Cache
Repeated searches may be cached for a short time.
Local Request History
Recent searches are stored locally in the browser.
CSV Export
Visible rows can be exported to CSV.
🚦 Rate Limit and Cache
Wifi Map & Data Search includes rate limiting and caching.
Example rate-limit format:
Limit: 119 left / reset 600s
This means the user has a certain number of requests remaining until the reset window.
Cache behavior:
Cache is valid for approximately 3 minutes.
Caching helps reduce repeated backend lookups for identical queries and improves response speed.
Rate limits help protect the service from abuse and ensure fair access.
🕓 Request History
The Request History panel stores recent searches locally in the browser.
History entries may include:
-
Search mode
-
Query value
-
ESSID match mode
-
Timestamp
Example safe history format:
bssid
00:11:22:33:44:55
17.06.2026, 21:47:35
Local history is useful for repeating previous searches, but it may contain sensitive search values.
Users should clear browser data or local history when working on shared or public devices.
📤 CSV Export
The tool can export visible rows to CSV.
CSV export may include:
-
BSSID
-
ESSID
-
Security type
-
Weak indicator
-
Coordinates
-
Other visible record fields
Sensitive values such as WiFi keys should be masked or excluded before sharing externally.
CSV exports should be stored securely and used only for authorized research, reporting, or internal audit workflows.
🔐 Security Field Interpretation
The Security column is based on heuristics and available dataset values.
Possible security labels may include:
-
Open
-
WEP
-
WPA
-
WPA2
-
WPA3
-
WPA2/WPA3
-
Unknown
Some internal numeric values may map to security guesses.
Example interpretation:
128 = possible WEP / Open
225 = possible WPA2
These values are heuristic and should not be treated as guaranteed technical truth.
Manual validation is recommended for security audits.
⚠️ Weak Indicator
The Weak field helps identify potentially risky hotspot records.
A network may be marked weak when:
-
The key is empty
-
The key is very short
-
The key is simple or common
-
The key appears in weak-password patterns
-
The security type is low
-
The network appears open or outdated
-
The encryption method is weak or uncertain
Weak indicators should be treated as triage signals, not final conclusions.
Organizations should review their own networks and replace weak configurations with strong WPA2/WPA3 security and unique passwords.
🧠 Result Interpretation
WiFi dataset results should be interpreted carefully.
Important notes:
-
Records may be historical.
-
Coordinates may be approximate.
-
ESSID names are not unique.
-
BSSID values can be spoofed or replaced.
-
WiFi keys may be outdated.
-
Security labels are heuristic.
-
A record appearing in the dataset does not guarantee current network availability.
-
A matching WiFi key must not be used for unauthorized access.
-
Map points may not represent the current physical location of an access point.
The tool should be used for research, verification, and defensive awareness, not for intrusion or unauthorized connectivity.
✅ Recommended Research Workflow
A responsible workflow should follow these steps.
1. Select the Correct Mode
Use BSSID for access point identifiers, ESSID for network names, and WiFi key search only for authorized security review.
2. Use Exact Search When Possible
Exact search reduces false positives, especially for ESSID values.
3. Review Security and Weak Indicators
Check whether the record suggests weak security or risky configuration.
4. Check Coordinates Carefully
Use map data as approximate context, not absolute proof.
5. Avoid Exposing Keys
Mask WiFi keys in reports, screenshots, and documentation.
6. Export Only What Is Needed
Use CSV export only for authorized workflows.
7. Remediate Owned Networks
If a network you control appears with a weak key or exposed record, rotate credentials and update security settings.
8. Validate Before Action
Do not assume that dataset records are current or fully accurate.
🛡️ Security, Privacy & Responsible Use
Wifi Map & Data Search is a sensitive OSINT and research tool. It must be used responsibly.
Acceptable use cases include:
-
Auditing your own WiFi networks
-
Checking whether known BSSIDs appear in public datasets
-
Reviewing exposure of organizational hotspots
-
Researching weak or reused WiFi configurations
-
Defensive wireless security assessment
-
Academic or statistical analysis of public WiFi data
-
Mapping public hotspot exposure trends
-
Supporting compliance and risk reviews
Strictly prohibited use includes:
Users must comply with the laws of their jurisdiction and platform rules. Misuse may result in account restriction or termination.
🔧 Remediation Recommendations
If an owned or authorized network appears in search results with risky data, recommended actions include:
Change the WiFi Password
Immediately rotate exposed or weak credentials.
Use WPA2/WPA3
Avoid WEP, open networks, and outdated encryption.
Use a Strong Unique Key
Use a long, random password that is not reused elsewhere.
Disable WPS
WPS can introduce additional attack surface.
Rename Sensitive ESSIDs
Avoid exposing company names, addresses, personal names, or device roles in the ESSID.
Segment Guest Networks
Keep guest WiFi separate from internal systems.
Review Router Firmware
Update access point firmware and apply security patches.
Monitor for Re-Exposure
Recheck periodically after remediation.
⚙️ Technical Highlights
-
WiFi hotspot intelligence tool
-
Available at
dash.niamonx.io/wifi_data -
Searches publicly available WiFi hotspot datasets
-
Supports BSSID search
-
Supports ESSID search
-
Supports WiFi key indicator search
-
ESSID match modes: substring, prefix, exact
-
Results table with BSSID, ESSID, security, weak indicator, coordinates, and actions
-
Leaflet map visualization
-
OpenStreetMap base layer
-
Map displays up to a limited number of points
-
Rate-limit counter
-
Short-term cache of approximately 3 minutes
-
Local browser request history
-
CSV export for visible rows
-
Security heuristics
-
Weak-key heuristics
-
Intended for research, audit, OSINT, and defensive security workflows
📌 Usage Hints
-
Use BSSID mode for exact access point MAC lookup.
-
Use ESSID exact mode when searching for a precise network name.
-
Use ESSID prefix or substring mode for broader discovery.
-
Treat coordinates as approximate or historical.
-
Do not use discovered keys for unauthorized access.
-
Mask WiFi keys in reports and screenshots.
-
Use the Weak field as a triage signal.
-
Use Security as a heuristic, not a guaranteed classification.
-
Cache is valid for approximately 3 minutes.
-
Rate limit shows remaining requests.
-
CSV export includes visible rows.
-
Clear local history on shared devices.
-
Check local laws before using WiFi dataset intelligence.
📬 Contact Information
For technical, legal, abuse, privacy, or support-related inquiries, users can contact the NiamonX team directly:
support@niamonx.io — Technical Support
other@niamonx.io — General Inquiries
takedown@niamonx.io — Privacy or Data Removal Requests
legal@niamonx.io — Legal and Compliance Matters
Alternative contact channel:
🔗 Helpdesk: https://support.niamonx.io/
Summary
NiamonX Wifi Map & Data Search is a WiFi hotspot intelligence tool for searching publicly available hotspot records by BSSID, ESSID, or WiFi key indicators. It provides structured results, security heuristics, weak-key indicators, coordinates, Leaflet map visualization, rate limiting, short-term caching, local browser history, and CSV export.
The tool is intended for lawful research, wireless security auditing, OSINT analysis, exposure review, and defensive remediation. It must never be used for unauthorized network access, harassment, credential misuse, or privacy-invasive activity.
IP Intelligence Search | Global IP Lookup
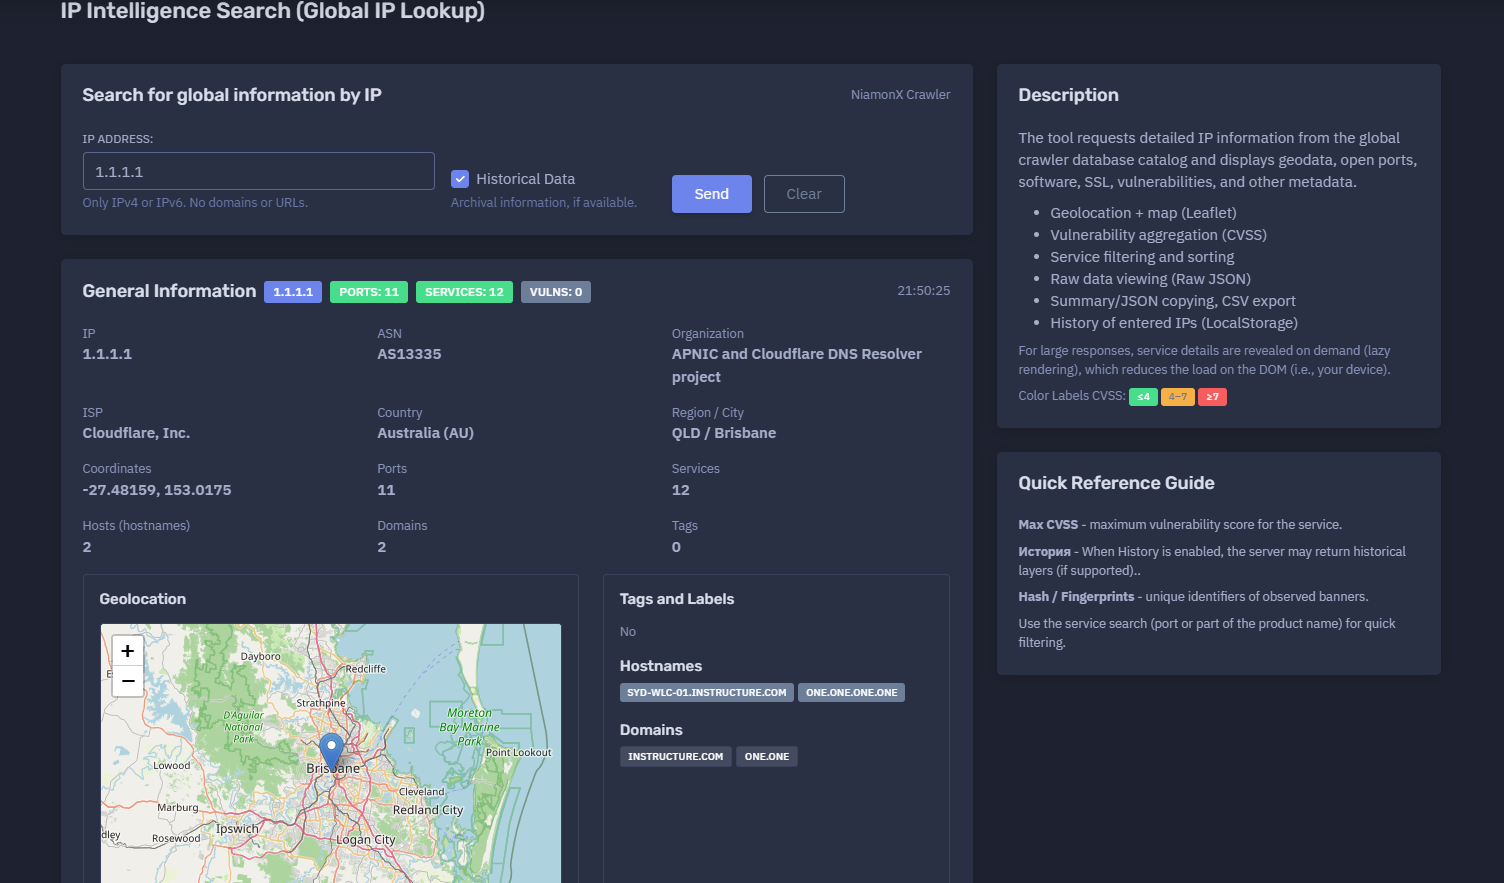
The platform available at https://dash.niamonx.io/global_iplookup — known as IP Intelligence Search (Global IP Lookup) — is a global IP intelligence and infrastructure analysis tool within the NiamonX platform. It allows users to search detailed information about IPv4 and IPv6 addresses using the NiamonX Crawler database catalog and receive structured data about geolocation, ASN, organization, ISP, open ports, services, hostnames, domains, vulnerabilities, fingerprints, and raw service metadata.
Overview of the Service
IP Intelligence Search (Global IP Lookup) is designed for analysts, SOC teams, cybersecurity researchers, incident responders, infrastructure owners, and OSINT specialists who need to understand what is publicly observable about a specific IP address.
The tool provides a consolidated view of an IP address from a global crawler database. It can show the IP’s network ownership, ASN, organization, ISP, country, region, city, coordinates, related hostnames, associated domains, exposed ports, detected products, service banners, HTTP metadata, SSL-related data when available, vulnerability aggregation, CVSS scoring, tags, labels, and raw JSON for deeper inspection.
The module accepts only IP addresses. Domains, URLs, paths, and search operators are not valid inputs.
🔍 How the Search Works
When a user enters an IPv4 or IPv6 address, the tool queries the global crawler database catalog and returns the available record for that IP.
The returned information may include:
-
General IP information
-
ASN and network ownership
-
ISP and organization
-
Country, region, city, and coordinates
-
Map location
-
Hostnames
-
Domains
-
Open ports
-
Protocols
-
Products and versions
-
Service details
-
HTTP metadata
-
SSL metadata, when available
-
Vulnerability data
-
CVE count
-
Maximum CVSS score
-
Scan dates
-
Raw service JSON
-
Historical layers, when available and enabled
The tool displays general information first, then provides a detailed services and ports table. Large service responses are rendered lazily, meaning details are shown only when the user expands a specific service row. This reduces browser and DOM load, especially for IPs with many open services.
🧩 What Can Be Searched
Global IP Lookup supports:
-
IPv4 addresses
-
IPv6 addresses
Valid examples:
1.1.1.1
8.8.8.8
2001:4860:4860::8888
Unsupported inputs:
example.com
https://example.com
example.com/login
1.1.1.1:443
The tool expects only a clean IPv4 or IPv6 value.
⚙️ Search Interface
The interface contains the main input and optional historical data setting.
IP Address
The main field where the user enters an IPv4 or IPv6 address.
Example:
1.1.1.1
The interface clearly states:
Only IPv4 or IPv6. No domains or URLs.
Historical Data
The Historical Data option allows the server to return archival information when supported.
Historical layers may include older observations, previous ports, older banners, previous technologies, or past service states.
Important: historical data is returned only when available and supported by the backend.
📊 General Information
After a successful lookup, the tool displays a general information panel for the IP address.
Possible fields include:
| Field | Description |
|---|---|
| IP | Queried IPv4 or IPv6 address |
| ASN | Autonomous System Number |
| Organization | Network owner or responsible organization |
| ISP | Internet Service Provider |
| Country | Country and country code |
| Region / City | Geographic region and city |
| Coordinates | Latitude and longitude |
| Ports | Number of observed ports |
| Services | Number of service records |
| Hosts | Number of hostnames |
| Domains | Number of related domains |
| Tags | Number of tags or labels |
Example structure:
IP: 1.1.1.1
ASN: AS13335
Organization: Example Network Project
ISP: Example ISP
Country: Australia (AU)
Region / City: QLD / Brisbane
Coordinates: -27.48159, 153.0175
Ports: 11
Services: 12
Vulns: 0
This section gives users a quick operational overview of the IP address before reviewing individual services.
🗺️ Geolocation and Map
The tool includes a geolocation map powered by Leaflet and OpenStreetMap.
The map displays the approximate location of the IP address based on geolocation data returned by the crawler database.
Possible location fields:
-
Country
-
Country code
-
Region
-
Region code
-
City
-
Latitude
-
Longitude
Important interpretation notes:
-
IP geolocation is approximate.
-
The city may represent network registration, routing, infrastructure, or geolocation provider estimation.
-
Coordinates may not represent the physical location of a device.
-
Cloud, CDN, VPN, proxy, and resolver IPs may show provider locations rather than end-user locations.
Geolocation should be used as context, not as precise physical attribution.
🏷️ Tags and Labels
The tool can display tags and labels returned by the crawler database.
Examples of possible tags:
-
CDN
-
Cloud
-
VPN
-
Proxy
-
Resolver
-
Hosting
-
Mail
-
Web
-
Database
-
Industrial
-
IoT
-
Remote access
No
🌐 Hostnames and Domains
The tool displays hostnames and domains associated with the IP address when available.
Hostnames
Hostnames may include DNS names, reverse DNS names, or observed service names.
Example:
one.one.one.one
Domains
Domains may include root domains or associated domains found in the crawler data.
Example:
one.one
Important notes:
-
Hostnames and domains may be historical.
-
Shared infrastructure may host many unrelated domains.
-
CDN and cloud IPs can be associated with multiple customers.
-
A hostname association does not always mean exclusive ownership of the IP.
🔌 Services and Ports
The Services / Ports section displays observed open ports and detected services.
The table may include:
| Column | Description |
|---|---|
| Port | Port number |
| Protocol | TCP or UDP |
| Product / Version | Detected product and version |
| CVEs | Number of linked CVEs |
| Max CVSS | Maximum vulnerability severity score |
| Scan | Scan date |
Example service rows:
53    TCP    —           0    —    2026-06-17
443   TCP    CloudFlare  0    —    2026-06-17
8880  TCP    CloudFlare  0    —    2026-06-17
The table can be filtered by port or product name, allowing analysts to quickly find relevant services.
🔎 Service Filtering and Sorting
The services table supports quick filtering.
Users can search by:
-
Port number
-
Product name
-
Version
-
Protocol
-
Service text
Example:
Filter: 443
Filter: CloudFlare
Sorting by columns helps analysts prioritize:
-
Exposed services
-
Highest CVSS score
-
Most recent scan date
-
Specific ports
-
Specific protocols
-
Products with known vulnerabilities
🧾 Service Details
Clicking the disclosure button on a service row opens detailed service information.
The details view may include:
Main
-
Product
-
Version
-
Operating system
-
Scan date
HTTP
-
HTTP status
-
Server header
-
Page title
-
Redirect location
-
WAF or CDN indicator
-
Headers hash
-
HTML hash
-
DOM hash
-
Robots data
-
Sitemap data
-
Security.txt data
-
Components
Location
-
City
-
Country
-
Coordinates
Vulnerabilities
-
CVE list
-
CVSS scores
-
Vulnerability metadata, when available
Raw JSON
-
Full normalized service record returned by the backend
This drill-down structure allows the interface to remain fast while still providing deep technical visibility when needed.
🌐 HTTP Metadata
For HTTP or HTTPS services, the tool may show HTTP-level metadata.
Possible fields include:
| Field | Description |
|---|---|
| Status | HTTP status code |
| Server | Server response header |
| Title | HTML page title |
| Location | Redirect target |
| WAF | Web application firewall or CDN indicator |
| Components | Detected technologies |
| HTML hash | Hash of returned HTML |
| Headers hash | Hash of headers |
| DOM hash | DOM fingerprint |
| Security.txt | Security policy file data, if found |
| Robots.txt | Robots file data, if found |
| Sitemap | Sitemap data, if found |
Example:
Status: 301
Server: cloudflare
Title: 301 Moved Permanently
Location: /
HTTP metadata is useful for web service fingerprinting, CDN detection, redirect analysis, and change tracking.
🧬 Hashes and Fingerprints
The tool may display multiple hashes and fingerprints.
Examples:
-
HTML hash
-
Headers hash
-
DOM hash
-
Server hash
-
Title hash
-
Banner hash
-
Service hash
These hashes are useful for:
-
Detecting repeated infrastructure
-
Finding similar services
-
Tracking changes over time
-
Fingerprinting web applications
-
Comparing banners
-
Identifying reused templates
-
Monitoring service drift
A hash does not identify a service by itself. It is a technical fingerprint that should be interpreted with context.
🛡️ Vulnerability Aggregation
The tool aggregates vulnerability data for services when CVEs are available.
The service table may show:
-
Number of CVEs
-
Maximum CVSS score
-
Vulnerability details
-
A severity color label
CVSS Color Labels
The interface may use color labels based on CVSS score.
General interpretation:
| CVSS Range | Severity |
|---|---|
| ≤ 4 | Low |
| 4–7 | Medium |
| ≥ 7 | High |
The Max CVSS field shows the maximum vulnerability score associated with the service.
Important: a CVE association does not always prove exploitability. Product detection, version accuracy, configuration, and exposure context must be validated manually.
📦 Raw JSON Viewer
Each service can include a raw JSON view.
Raw JSON may contain:
-
Product detection
-
HTTP metadata
-
Scan timestamp
-
Organization
-
ISP
-
ASN
-
Port
-
Protocol
-
Hostnames
-
Domains
-
Location
-
CPE / CPE 2.3 identifiers
-
Hashes
-
Banner data
-
Scanner metadata
-
Transport information
-
Vulnerability data
Raw JSON is useful for:
-
Technical diagnostics
-
API workflows
-
Evidence preservation
-
Security reporting
-
Advanced analysis
-
Integration with SIEM or case systems
-
Comparing normalized and raw fields
Raw data should be handled carefully because it may include detailed infrastructure fingerprints.
🕓 Historical Data
When the Historical Data option is enabled, the backend may return archival information if supported.
Historical data can help analysts understand:
-
Previously open ports
-
Past service banners
-
Old product versions
-
Previous hostnames
-
Infrastructure changes
-
Exposure timeline
-
Service drift
-
Reappearance of risky services
Important interpretation:
When History is enabled, the server may return historical layers if supported.
Historical data may not be available for every IP address and should be clearly separated from current observations.
📤 Export and Copy Options
The tool supports analyst-friendly export and copy workflows.
Possible output options include:
-
Summary copying
-
JSON copying
-
CSV export
-
Raw service JSON viewing
-
Filtered service review
CSV export is useful for:
-
Port inventory
-
Exposure reports
-
Vulnerability review
-
Asset documentation
-
SOC workflows
-
Compliance evidence
-
Incident response records
Exports should be stored securely, especially when they include infrastructure fingerprints or vulnerability data.
🕘 Request History
The tool may store entered IPs in local browser history through LocalStorage.
History can help users quickly repeat previous lookups.
Local history may include:
-
IP address
-
Query timestamp
-
Search mode
-
History option state
-
Basic result metadata
Because this history is browser-local, it may be cleared when users delete browser data or switch devices.
🧠 Key Features
Global IP Lookup
Search detailed information about IPv4 and IPv6 addresses.
NiamonX Crawler Database
Results come from the global crawler database catalog.
General IP Intelligence
Shows ASN, organization, ISP, country, region, city, coordinates, ports, services, hostnames, domains, and tags.
Geolocation Map
Displays approximate location on a Leaflet / OpenStreetMap map.
Service and Port Inventory
Lists observed open ports, protocols, products, versions, scan dates, CVE counts, and Max CVSS.
Vulnerability Aggregation
Aggregates CVE and CVSS data per service when available.
Raw JSON
Allows detailed inspection of service-level raw records.
Lazy Rendering
Large service details are rendered only when opened, reducing browser load.
Historical Data
Can request archival information when supported.
Filtering and Sorting
Users can search services by port or product name and sort columns.
Export
Supports summary / JSON copy and CSV export.
Local History
Stores previously entered IPs locally in the browser.
✅ Recommended Analyst Workflow
A practical IP investigation workflow should follow these steps.
1. Enter a Clean IP Address
Use only IPv4 or IPv6. Do not include domains, URLs, ports, or paths.
2. Review General Information
Check ASN, organization, ISP, country, region, city, coordinates, ports, services, hostnames, and domains.
3. Check Geolocation
Use the map for approximate context, but do not treat it as exact physical attribution.
4. Review Open Ports
Sort and filter services by port, product, scan date, or CVSS score.
5. Expand Important Services
Open details for exposed web services, remote access services, databases, or unusual ports.
6. Review Vulnerability Data
Check CVE count and Max CVSS, but validate product and version accuracy before making conclusions.
7. Inspect Raw JSON When Needed
Use raw data for deeper technical analysis or integration workflows.
8. Compare Current and Historical Data
Enable historical data when investigating exposure changes over time.
9. Export Evidence
Use CSV or JSON export for internal reporting.
10. Validate Before Action
Confirm important findings with additional tools, asset owners, or direct authorized scans.
🛡️ Security, Privacy & Responsible Use
IP Intelligence Search is intended for lawful cybersecurity, OSINT, asset analysis, incident response, and exposure management.
Acceptable use cases include:
-
Checking your own infrastructure
-
Investigating suspicious IPs
-
Reviewing exposed services
-
SOC triage
-
Threat intelligence enrichment
-
Vulnerability exposure review
-
Asset inventory validation
-
Incident response
-
Historical infrastructure analysis
-
Compliance reporting
Users must follow responsible use rules:
-
Do not use the tool to attack systems.
-
Do not use exposed services for unauthorized access.
-
Do not exploit vulnerabilities discovered through the tool.
-
Do not harass, disrupt, or target third-party infrastructure.
-
Validate vulnerability findings before escalation.
-
Respect applicable laws and authorization boundaries.
-
Treat exported infrastructure data as sensitive.
-
Use results for defensive and analytical purposes only.
⚙️ Technical Highlights
-
Global IP intelligence search
-
Available at
dash.niamonx.io/global_iplookup -
Powered by NiamonX Crawler database catalog
-
Supports IPv4 and IPv6
-
Rejects domains and URLs
-
Optional historical data
-
General IP profile
-
ASN, organization, ISP, country, city, and coordinates
-
Leaflet geolocation map
-
Hostnames and domains
-
Tags and labels
-
Services and ports table
-
TCP and UDP support
-
Product and version detection
-
HTTP metadata
-
SSL metadata when available
-
CPE and CPE 2.3 identifiers
-
Vulnerability aggregation
-
CVE counts
-
Max CVSS field
-
CVSS color labels
-
Port and product filtering
-
Column sorting
-
Service detail disclosure
-
Lazy rendering for large responses
-
Raw JSON viewer
-
Summary / JSON copy
-
CSV export
-
LocalStorage history of entered IPs
-
Suitable for SOC, OSINT, vulnerability review, asset monitoring, and incident response workflows
📌 Usage Hints
-
Enter only an IPv4 or IPv6 address.
-
Do not enter domains, URLs, paths, or IP:port values.
-
Use the service search field to filter by port or product name.
-
Check Max CVSS for quick vulnerability triage.
-
Expand service details for HTTP headers, banners, fingerprints, and raw JSON.
-
Use historical data when investigating changes over time.
-
Treat geolocation as approximate.
-
Treat CVE matches as leads until validated.
-
Use CSV export for service inventory.
-
Use JSON copy for technical workflows.
-
Clear local history on shared devices.
-
Use findings only for lawful defensive analysis.
📬 Contact Information
For technical, legal, abuse, privacy, or support-related inquiries, users can contact the NiamonX team directly:
support@niamonx.io — Technical Support
other@niamonx.io — General Inquiries
takedown@niamonx.io — Privacy or Data Removal Requests
legal@niamonx.io — Legal and Compliance Matters
Alternative contact channel:
🔗 Helpdesk: https://support.niamonx.io/
Summary
NiamonX IP Intelligence Search (Global IP Lookup) is a global IP intelligence tool for analyzing IPv4 and IPv6 addresses through the NiamonX Crawler database catalog.
It provides ASN, organization, ISP, geolocation, hostnames, domains, open ports, services, products, HTTP metadata, fingerprints, CVEs, CVSS scores, historical layers, raw JSON, filtering, sorting, CSV export, and local lookup history.
The tool is designed for lawful OSINT, SOC triage, threat intelligence, vulnerability review, asset monitoring, compliance, and incident response. Results should be treated as intelligence signals and validated before operational or security decisions.
IP Calculator | IPv4 Subnet, Converter & Network Toolkit
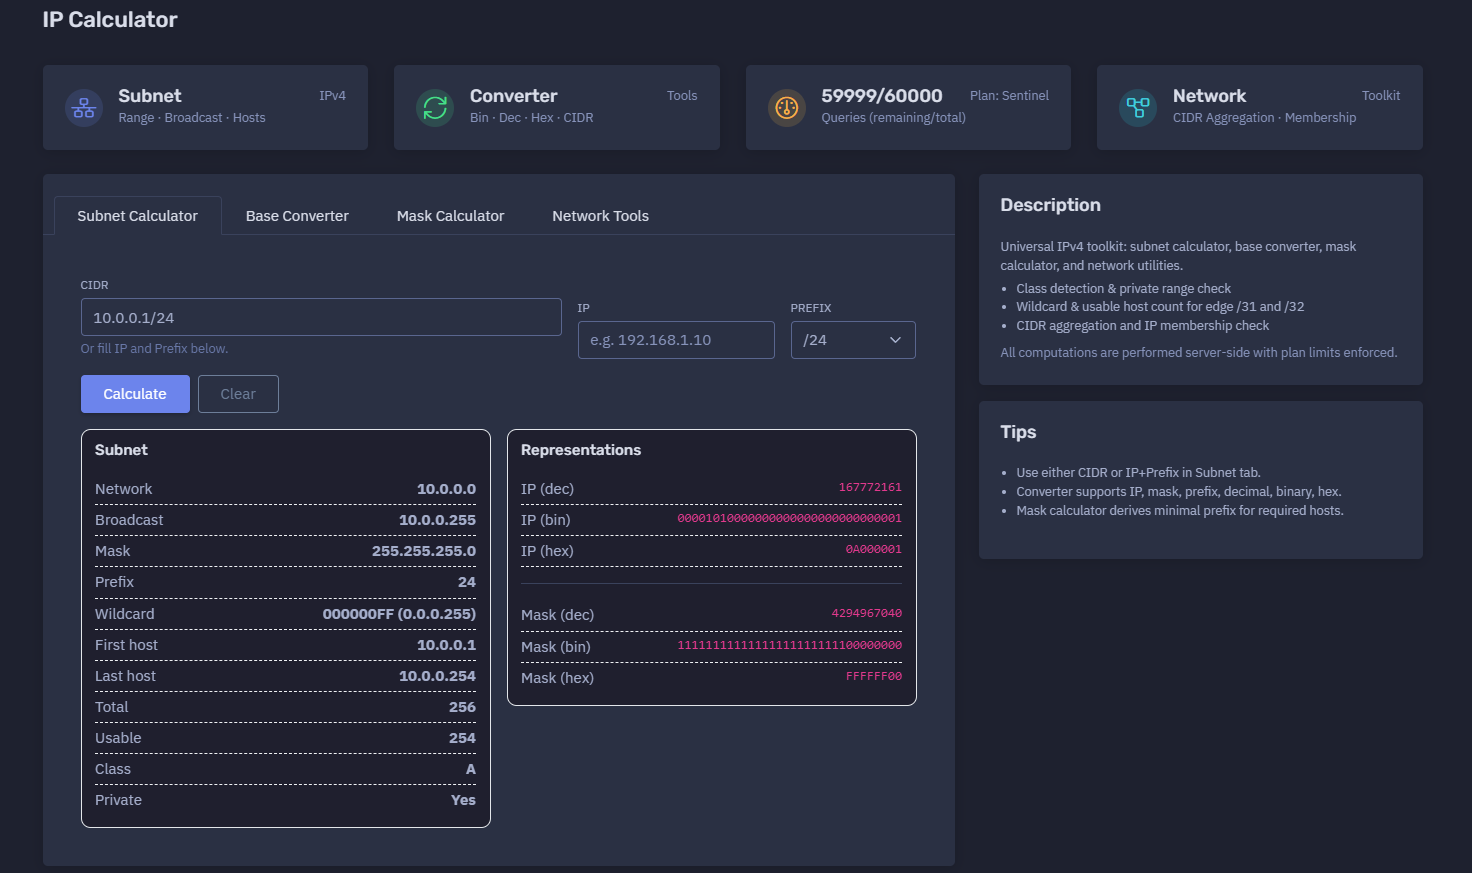
The platform available at https://dash.niamonx.io/ipcalc_net — known as IP Calculator — is a universal IPv4 network toolkit within the NiamonX platform. It helps users calculate subnets, convert IPv4 values between different representations, derive subnet masks, check address ranges, calculate usable hosts, work with wildcard masks, and perform practical network planning tasks.
Overview of the Service
IP Calculator is designed for network engineers, system administrators, cybersecurity analysts, DevOps teams, students, and technical users who need a fast and reliable way to calculate IPv4 subnet information.
The tool combines several network utilities in one interface:
-
Subnet Calculator
-
Base Converter
-
Mask Calculator
-
Network Tools
-
CIDR Aggregation
-
IP Membership Check
It can calculate network address, broadcast address, subnet mask, wildcard mask, first host, last host, total addresses, usable hosts, IP class, private range status, decimal representation, binary representation, hexadecimal representation, and mask representations.
All computations are performed server-side, and access is controlled through plan-based query limits.
🔍 How the Tool Works
The user can either enter a full CIDR value or provide an IP address and prefix separately.
Example CIDR input:
10.0.0.1/24
The tool parses the address, applies the prefix, and calculates the full subnet range.
For example, for:
10.0.0.1/24
the tool returns:
Network: 10.0.0.0
Broadcast: 10.0.0.255
Mask: 255.255.255.0
First host: 10.0.0.1
Last host: 10.0.0.254
Total: 256
Usable: 254
The interface also shows technical representations of both the IP address and subnet mask in decimal, binary, and hexadecimal formats.
🧩 Main Tool Modules
IP Calculator includes several practical modules.
Subnet Calculator
Calculates subnet boundaries and host ranges from an IPv4 address and CIDR prefix.
Useful for:
-
Network planning
-
IP range validation
-
Firewall rule preparation
-
Routing configuration
-
Infrastructure documentation
-
Lab exercises
-
Security segmentation
Base Converter
Converts IPv4 values between different formats.
Supported conversion types may include:
-
IP address
-
Subnet mask
-
Prefix
-
Decimal
-
Binary
-
Hexadecimal
Mask Calculator
Calculates subnet mask and prefix information.
It can also derive the minimal prefix required for a desired number of hosts.
Network Tools
Provides additional utilities for CIDR aggregation, range operations, and membership checks.
CIDR Aggregation
Helps combine compatible networks into a shorter aggregated CIDR block when possible.
IP Membership Check
Checks whether a specific IP address belongs to a selected subnet or range.
⚙️ Interface Structure
The interface is divided into practical tabs and panels.
Main sections:
| Section | Purpose |
|---|---|
| Subnet Calculator | Calculate subnet range and host information |
| Base Converter | Convert IP values between decimal, binary, hex, and CIDR formats |
| Mask Calculator | Calculate prefix, mask, wildcard, and host capacity |
| Network Tools | Work with aggregation, ranges, and membership checks |
| Request History | Review recent local calculations |
The interface also displays daily query limits based on the current plan.
Example:
59999 / 60000
Queries remaining / total
Plan: Sentinel
🧮 Subnet Calculator
The Subnet Calculator is the main module for IPv4 subnet analysis.
Users can provide input in two ways:
CIDR Input
Example:
10.0.0.1/24
IP + Prefix Input
Example:
IP: 192.168.1.10
Prefix: /24
Both input methods produce the same type of subnet output.
📊 Subnet Output Fields
After calculation, the tool displays the subnet details.
| Field | Description |
|---|---|
| Network | First address of the subnet |
| Broadcast | Broadcast address of the subnet |
| Mask | Subnet mask in dotted decimal format |
| Prefix | CIDR prefix length |
| Wildcard | Inverse subnet mask |
| First host | First usable host address |
| Last host | Last usable host address |
| Total | Total number of addresses in the subnet |
| Usable | Number of usable host addresses |
| Class | IPv4 class |
| Private | Whether the address belongs to a private range |
Example result:
Network: 10.0.0.0
Broadcast: 10.0.0.255
Mask: 255.255.255.0
Prefix: 24
Wildcard: 0.0.0.255
First host: 10.0.0.1
Last host: 10.0.0.254
Total: 256
Usable: 254
Class: A
Private: Yes
🌐 Network Address
The Network field shows the first address of the subnet.
Example:
10.0.0.0
The network address identifies the subnet itself and is normally not assigned to a regular host.
📡 Broadcast Address
The Broadcast field shows the last address of the subnet.
Example:
10.0.0.255
In traditional IPv4 networking, the broadcast address is used to send packets to all hosts in the subnet.
For most standard subnets, the broadcast address is not assigned to a normal host.
🎭 Subnet Mask
The Mask field shows the subnet mask in dotted decimal notation.
Example:
255.255.255.0
A subnet mask defines which part of the IP address belongs to the network and which part belongs to host addressing.
🧱 Prefix
The Prefix field shows the CIDR prefix length.
Example:
/24
The prefix indicates how many bits are used for the network portion.
Common prefixes:
| Prefix | Mask | Typical Use |
|---|---|---|
| /8 | 255.0.0.0 | Large private or enterprise blocks |
| /16 | 255.255.0.0 | Medium-sized internal networks |
| /24 | 255.255.255.0 | Common LAN subnet |
| /30 | 255.255.255.252 | Point-to-point links |
| /31 | 255.255.255.254 | Point-to-point links with special handling |
| /32 | 255.255.255.255 | Single host route |
🃏 Wildcard Mask
The Wildcard field shows the inverse of the subnet mask.
Example:
000000FF (0.0.0.255)
Wildcard masks are commonly used in:
-
ACL rules
-
Routing policies
-
Network matching
-
Firewall logic
-
Cisco-style configurations
For a /24 subnet, the mask is:
255.255.255.0
and the wildcard is:
0.0.0.255
🖥️ First and Last Host
The tool calculates the usable host range.
Example for /24:
First host: 10.0.0.1
Last host: 10.0.0.254
These are the first and last usable IP addresses in the subnet.
For special prefixes such as /31 and /32, usable host logic is handled as an edge case.
🔢 Total and Usable Addresses
The Total field shows the total number of addresses in the subnet.
The Usable field shows how many addresses can typically be assigned to hosts.
Example:
Total: 256
Usable: 254
For most IPv4 subnets, usable addresses exclude the network and broadcast addresses.
Special cases:
-
/31is commonly used for point-to-point links. -
/32represents a single host route.
The tool accounts for usable host count in these edge cases.
🏷️ Class Detection
The tool detects the traditional IPv4 class of the entered address.
IPv4 class ranges:
| Class | Range | Notes |
|---|---|---|
| A | 1.0.0.0 – 126.255.255.255 | Large networks |
| B | 128.0.0.0 – 191.255.255.255 | Medium networks |
| C | 192.0.0.0 – 223.255.255.255 | Smaller networks |
| D | 224.0.0.0 – 239.255.255.255 | Multicast |
| E | 240.0.0.0 – 255.255.255.255 | Reserved / experimental |
Class detection is useful for educational and compatibility contexts, although modern networking primarily uses CIDR.
🔐 Private Range Check
The Private field indicates whether the IP belongs to a private IPv4 range.
Private IPv4 ranges:
| Range | CIDR |
|---|---|
| 10.0.0.0 – 10.255.255.255 | 10.0.0.0/8 |
| 172.16.0.0 – 172.31.255.255 | 172.16.0.0/12 |
| 192.168.0.0 – 192.168.255.255 | 192.168.0.0/16 |
Example:
Private: Yes
Private addresses are normally used inside internal networks and are not directly routed on the public Internet.
🔄 Representations
The Representations section shows the IP address and mask in multiple numeric bases.
For the IP:
10.0.0.1
the tool may show:
IP (dec): 167772161
IP (bin): 00001010000000000000000000000001
IP (hex): 0A000001
For the mask:
255.255.255.0
the tool may show:
Mask (dec): 4294967040
Mask (bin): 11111111111111111111111100000000
Mask (hex): FFFFFF00
These representations are useful for:
-
Low-level networking
-
Binary subnetting exercises
-
Debugging address calculations
-
Protocol analysis
-
Security tooling
-
Developer workflows
🔢 Base Converter
The Base Converter supports conversion between IP-related formats.
Supported values may include:
-
IPv4 dotted decimal
-
Decimal integer
-
Binary
-
Hexadecimal
-
Prefix
-
Mask
-
Wildcard
Example decimal value:
4294967295
Example binary value:
11111111111111111111111111111111
Example hexadecimal value:
FFFFFFFF
The converter helps users move between human-readable IP formats and machine-level representations.
🎯 Mask Calculator
The Mask Calculator can derive subnet information from a prefix or from required host capacity.
Example prefix input:
prefix = 24
Expected output:
/24
255.255.255.0
The mask calculator can also derive the minimal prefix for a required number of hosts.
Example use case:
Required hosts: 200
The tool calculates the smallest subnet that can contain the requested number of usable addresses.
This is useful for:
-
VLAN planning
-
Office network planning
-
Cloud subnet sizing
-
Lab design
-
Address allocation
-
Avoiding wasted IP space
🧩 CIDR Aggregation
CIDR aggregation helps combine adjacent networks into a shorter summary route when possible.
Example use cases:
-
Route summarization
-
Firewall rule simplification
-
ACL optimization
-
Cloud network planning
-
Reducing routing table entries
-
Grouping related subnets
Aggregation should be used carefully because an overly broad summary may include addresses that should not be covered by a rule.
✅ IP Membership Check
The membership check helps determine whether an IP belongs to a given subnet.
Example question:
Does 192.168.1.50 belong to 192.168.1.0/24?
Expected result:
Yes
This is useful for:
-
Firewall troubleshooting
-
VPN routing checks
-
Access control validation
-
Network segmentation review
-
Incident response
-
Log analysis
🕓 Request History
The tool stores recent calculations locally in the user’s browser.
Example behavior:
We store the last 200 queries locally in your browser.
History entries may include:
-
Tool mode
-
Input value
-
Calculated range
-
Timestamp
-
Conversion type
-
Result summary
Example history item:
subnet
10.0.0.1/24
10.0.0.0..10.0.0.255
17.06.2026, 21:53:23
Request history is useful for repeating calculations, reviewing previous subnet work, and documenting network planning sessions.
Because history is stored locally in the browser, it may be cleared by deleting browser data or using another device.
🚦 Query Limits and Plan Access
IP Calculator uses plan-based query limits.
Example:
59999 / 60000
Queries remaining / total
Plan: Sentinel
Important points:
-
Computations are performed server-side.
-
Plan limits are enforced.
-
Remaining query count is displayed in the interface.
-
Local history does not replace server-side usage limits.
🧠 Key Features
Universal IPv4 Toolkit
Combines subnet calculation, conversion, mask calculation, and network utilities.
CIDR Support
Accepts CIDR notation such as:
192.168.1.10/24
IP + Prefix Input
Users can enter IP and prefix separately.
Subnet Range Calculation
Returns network, broadcast, first host, last host, total addresses, and usable addresses.
Wildcard Mask
Calculates wildcard mask in hexadecimal and dotted decimal formats.
Base Conversion
Converts IP and mask values to decimal, binary, and hexadecimal.
Class Detection
Detects traditional IPv4 class.
Private Range Detection
Checks whether an IP belongs to RFC1918-style private address ranges.
Edge Case Handling
Handles usable host calculations for /31 and /32.
Mask Calculator
Derives prefix and mask values, including host-based sizing.
CIDR Aggregation
Supports network summarization workflows.
Membership Check
Checks whether an IP belongs to a specific subnet.
Local Request History
Stores up to 200 recent calculations in the browser.
📌 Practical Examples
Example 1: Standard LAN Subnet
Input:
192.168.1.10/24
Result:
Network: 192.168.1.0
Broadcast: 192.168.1.255
Mask: 255.255.255.0
Usable hosts: 254
Private: Yes
Use case:
-
Office LAN
-
Home network
-
Small VLAN
Example 2: Larger Private Subnet
Input:
192.168.1.10/20
Result:
Network: 192.168.0.0
Broadcast: 192.168.15.255
Use case:
-
Larger internal segment
-
Lab environment
-
Department-level subnet
Example 3: Decimal Conversion
Input:
4294967295
Possible output:
IP: 255.255.255.255
Binary: 11111111111111111111111111111111
Hex: FFFFFFFF
Use case:
-
Low-level networking
-
Binary conversion
-
Developer debugging
Example 4: Prefix to Mask
Input:
prefix: 24
Output:
/24
255.255.255.0
Wildcard: 0.0.0.255
Use case:
-
Firewall rules
-
Router configuration
-
Documentation
✅ Recommended Workflow
A practical workflow depends on the user’s goal.
For Subnet Planning
-
Enter CIDR notation or IP + prefix.
-
Review network and broadcast address.
-
Check usable host count.
-
Confirm private/public status.
-
Copy mask and wildcard values for configuration.
For Firewall Rules
-
Calculate subnet and wildcard mask.
-
Validate range boundaries.
-
Check membership for test IPs.
-
Avoid overly broad CIDR blocks.
For Cloud Networking
-
Calculate required host capacity.
-
Use Mask Calculator to derive minimal prefix.
-
Reserve space for growth.
-
Validate non-overlap with existing networks.
For Troubleshooting
-
Convert IPs to binary or decimal.
-
Compare masks.
-
Check IP membership.
-
Confirm network boundaries.
🛡️ Security and Responsible Use
IP Calculator is a technical utility intended for legitimate network planning, education, administration, and cybersecurity workflows.
Acceptable use cases include:
-
Subnet planning
-
VLAN design
-
Firewall configuration
-
Routing documentation
-
Cloud network sizing
-
VPN troubleshooting
-
Incident response
-
Log analysis
-
Security lab exercises
-
Network education
Users should apply results carefully:
-
Validate configurations before deploying them.
-
Avoid overly broad firewall rules.
-
Confirm CIDR ranges before adding routes.
-
Check overlap between networks.
-
Use membership checks before changing access controls.
-
Document subnet decisions clearly.
-
Treat local history as potentially sensitive on shared devices.
⚙️ Technical Highlights
-
Universal IPv4 network toolkit
-
Available at
dash.niamonx.io/ipcalc_net -
Subnet Calculator
-
Base Converter
-
Mask Calculator
-
Network Tools
-
CIDR input support
-
IP + Prefix input support
-
Network address calculation
-
Broadcast address calculation
-
Subnet mask calculation
-
Wildcard mask calculation
-
First and last host calculation
-
Total and usable address count
-
IPv4 class detection
-
Private range check
-
Decimal representation
-
Binary representation
-
Hexadecimal representation
-
Mask conversion
-
Prefix conversion
-
Wildcard conversion
-
CIDR aggregation
-
IP membership check
-
Edge handling for
/31and/32 -
Server-side computation
-
Plan-based query limits
-
Local browser history
-
Stores last 200 queries locally
-
Suitable for network engineering, DevOps, SOC, education, and infrastructure planning
📌 Usage Hints
-
Use either CIDR or IP + Prefix in the Subnet tab.
-
Converter supports IP, mask, prefix, decimal, binary, and hex.
-
Mask Calculator can derive the minimal prefix for required hosts.
-
Use wildcard masks for ACL and firewall logic.
-
Check private/public status before routing decisions.
-
Use membership checks before changing firewall rules.
-
Be careful with aggregation because it may include extra addresses.
-
Recheck
/31and/32behavior when working with point-to-point or host routes. -
Store exported or copied calculations carefully if they describe internal infrastructure.
-
Clear local history on shared devices.
📬 Contact Information
For technical, legal, abuse, privacy, or support-related inquiries, users can contact the NiamonX team directly:
support@niamonx.io — Technical Support
other@niamonx.io — General Inquiries
takedown@niamonx.io — Privacy or Data Removal Requests
legal@niamonx.io — Legal and Compliance Matters
Alternative contact channel:
🔗 Helpdesk: https://support.niamonx.io/
Summary
NiamonX IP Calculator is a universal IPv4 subnet and conversion toolkit for calculating network ranges, broadcast addresses, subnet masks, wildcard masks, usable hosts, decimal / binary / hexadecimal representations, CIDR aggregation, and IP membership.
It is designed for network planning, routing, firewall configuration, cloud infrastructure, SOC workflows, DevOps, education, and troubleshooting. The tool performs calculations server-side, enforces plan-based limits, and stores the last 200 queries locally in the browser for convenience.
IP / Domain Explorer | IP and Domain Geolocation & Network Intelligence
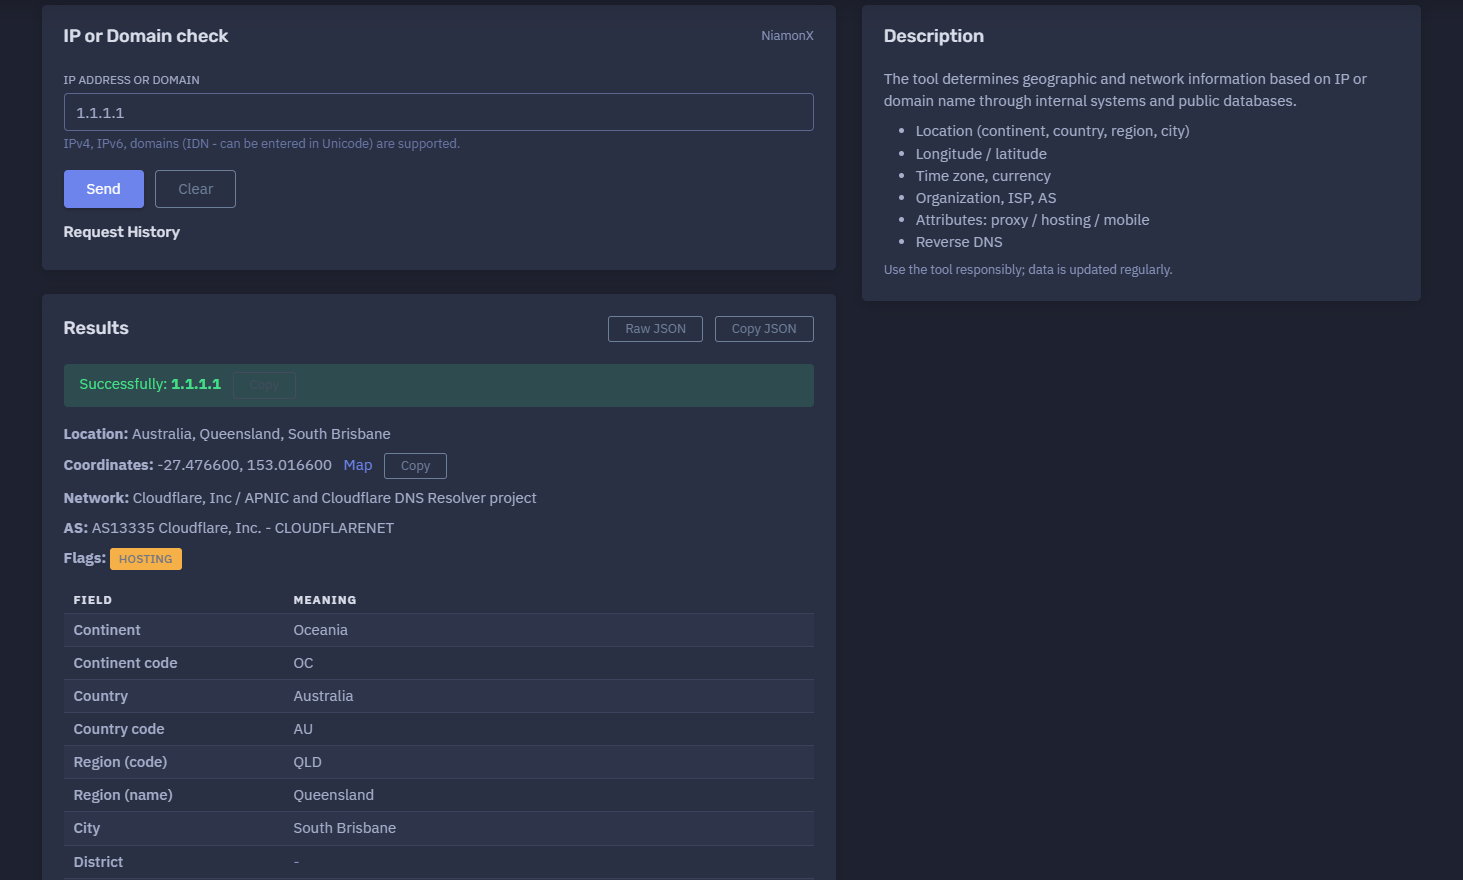
The platform available at https://dash.niamonx.io/ipexplorer — known as IP / Domain Explorer — is a lightweight IP and domain intelligence tool within the NiamonX platform. It allows users to check geographic, network, ASN, ISP, reverse DNS, and infrastructure attributes for an IPv4 address, IPv6 address, or domain name.
Overview of the Service
IP / Domain Explorer is designed to quickly identify where an IP address or domain is located from a network intelligence perspective and which organization, ISP, Autonomous System, and infrastructure attributes are associated with it.
The tool combines internal NiamonX systems with public databases to provide a structured overview of IP or domain metadata. It is useful for cybersecurity analysts, SOC teams, system administrators, fraud investigators, OSINT researchers, compliance teams, and technical users who need a fast way to understand the basic network profile of an address or domain.
The module supports:
-
IPv4 addresses
-
IPv6 addresses
-
Domains
-
Internationalized domain names entered in Unicode
The result includes location, coordinates, timezone, currency, network ownership, ASN, reverse DNS, and classification flags such as proxy, hosting, or mobile network.
🔍 How the Tool Works
When a user enters an IP address or domain name, IP / Domain Explorer performs a lookup through internal systems and public intelligence databases.
For domain input, the tool resolves or analyzes the domain and returns the available network and geolocation information. For IP input, the tool directly checks the IP address against available IP intelligence sources.
The returned result is displayed as a structured report containing:
-
Location
-
Coordinates
-
Network owner
-
ISP
-
Organization
-
Autonomous System
-
Reverse DNS
-
Hosting / proxy / mobile flags
-
Timezone
-
Currency
-
HTTP status
-
Source information
The result is intended to provide quick situational awareness, not a final legal or attribution conclusion.
🧩 What Can Be Searched
IP / Domain Explorer accepts the following input types.
IPv4 Address
Example:
1.1.1.1
IPv6 Address
Example:
2606:4700:4700::1111
Domain Name
Example:
example.com
Internationalized Domain Name
Domains with Unicode characters are supported when accepted by the backend.
Example:
пример.рф
The tool should not be used with full URLs, URL paths, or unrelated search operators.
Invalid examples:
https://example.com/login
example.com/path/page.html
1.1.1.1:443
For best results, users should enter only a clean IP address or domain name.
⚙️ Search Interface
The main interface contains a simple input field.
IP Address or Domain
The user enters an IPv4 address, IPv6 address, or domain.
Example:
1.1.1.1
The interface indicates that IPv4, IPv6, and domains are supported, including IDN domains entered in Unicode.
After submission, the tool returns a structured result panel.
📊 Result Overview
A successful lookup displays a short summary at the top of the result.
Example structure:
Successfully: 1.1.1.1
Location: Australia, Queensland, South Brisbane
Coordinates: -27.476600, 153.016600
Network: Cloudflare, Inc / APNIC and Cloudflare DNS Resolver project
AS: AS13335 Cloudflare, Inc. - CLOUDFLARENET
Flags: Hosting
This summary gives the user a quick understanding of:
-
Whether the lookup succeeded
-
Where the IP is geographically mapped
-
Which organization or ISP operates it
-
Which AS network it belongs to
-
Whether it is marked as hosting, proxy, or mobile infrastructure
🌍 Location Information
The tool returns geographic fields associated with the IP or resolved domain.
Possible location fields include:
| Field | Description |
|---|---|
| Continent | Continent name |
| Continent code | Short continent code |
| Country | Country name |
| Country code | ISO country code |
| Region code | Short region or state code |
| Region name | Full region or state name |
| City | City associated with the IP |
| District | District or area, if available |
| Postal code | Postal or ZIP code, if available |
| Latitude | Approximate latitude |
| Longitude | Approximate longitude |
Example:
Continent: Oceania
Country: Australia
Region: Queensland
City: South Brisbane
Latitude: -27.476600
Longitude: 153.016600
Geolocation data should be treated as approximate. It may represent a network registration location, provider infrastructure, routing endpoint, cloud region, or database estimate rather than the exact physical location of a device or user.
🗺️ Coordinates and Map
When latitude and longitude are available, the result can show a map link or map view.
Coordinates are useful for:
-
Approximate location review
-
Network region analysis
-
Fraud investigation context
-
Infrastructure mapping
-
SOC triage
-
OSINT enrichment
-
Regional routing analysis
Important interpretation:
-
IP coordinates are not GPS coordinates of a person.
-
Cloud and CDN IPs often map to provider infrastructure.
-
VPN, proxy, and hosting IPs may not represent the real user location.
-
Geolocation accuracy varies by provider and region.
Coordinates should be used as context, not as proof of physical presence.
🏢 Network and Organization
The tool displays network ownership and provider details.
Possible fields include:
| Field | Description |
|---|---|
| ISP | Internet Service Provider |
| Organization | Organization associated with the IP |
| AS | Autonomous System Number and organization |
| AS Name | Autonomous System name |
| Network | Combined provider and organization information |
Example:
ISP: Cloudflare, Inc
Organization: APNIC and Cloudflare DNS Resolver project
AS: AS13335 Cloudflare, Inc.
AS Name: CLOUDFLARENET
This information is useful for identifying whether an address belongs to a hosting provider, corporate network, residential ISP, CDN, DNS resolver, mobile operator, cloud platform, or other infrastructure type.
🔢 ASN Information
The AS field identifies the Autonomous System associated with the IP.
An Autonomous System is a network or group of networks operated under a single routing policy.
Example:
AS13335 Cloudflare, Inc.
ASN information is useful for:
-
Network attribution
-
Routing analysis
-
Threat intelligence enrichment
-
Provider identification
-
Abuse reporting
-
Firewall and allowlist decisions
-
Infrastructure mapping
ASN ownership should not be confused with end-user identity. Many users, services, and customers can share infrastructure under the same ASN.
🔁 Reverse DNS
The Reverse DNS field shows the PTR hostname associated with the IP address when available.
Example:
one.one.one.one
Reverse DNS is useful for:
-
Identifying service naming
-
Confirming provider ownership
-
Enriching logs
-
Detecting mail infrastructure
-
Reviewing hosting patterns
-
Investigating suspicious IPs
Reverse DNS is not always present, and when present, it may be outdated, generic, or controlled by the network operator.
🏷️ Flags and Attributes
IP / Domain Explorer can display infrastructure attributes.
Common flags include:
| Flag | Meaning |
|---|---|
| Mobile Network | Indicates whether the IP appears to belong to a mobile network |
| Proxy | Indicates whether the IP may be associated with proxy infrastructure |
| Hosting | Indicates whether the IP appears to belong to hosting, cloud, CDN, or data center infrastructure |
Example:
Mobile Network: false
Proxy: false
Hosting: true
These attributes help users quickly understand the type of infrastructure behind an IP.
Important: flags are based on available intelligence and heuristics. They should be used as indicators, not absolute proof.
🕒 Time Zone and UTC Offset
The tool returns timezone information based on the geolocation result.
Possible fields:
-
Time zone
-
UTC offset
Example:
Time zone: Australia/Brisbane
Offset: UTC+10
Timezone information is useful for:
-
Event correlation
-
Log analysis
-
Regional context
-
Fraud review
-
Incident timeline construction
-
Travel or access pattern analysis
Because IP geolocation may be approximate, timezone data should also be treated as contextual.
💱 Currency
The result may include the local currency for the detected country.
Example:
Currency: AUD
Currency is useful for enrichment and regional context, especially in fraud analysis, compliance workflows, and user-location review.
🌐 HTTP Code and Source
The result can include request-level metadata such as HTTP code and data source.
Example:
HTTP Code: 200
Source: niamonx.io
The HTTP code indicates whether the lookup request succeeded at the service level.
The source field identifies the platform or internal lookup provider used for the result display.
🧠 Key Features
IP and Domain Lookup
Supports IPv4, IPv6, and domain names.
IDN Support
Internationalized domain names can be entered in Unicode when supported.
Geolocation
Returns continent, country, region, city, postal code, latitude, and longitude.
Map Link
Coordinates can be used for map-based location review.
Network Ownership
Shows ISP, organization, ASN, and AS name.
Reverse DNS
Returns PTR hostname when available.
Infrastructure Flags
Displays proxy, hosting, and mobile network indicators.
Timezone and Currency
Adds regional context for investigations and analysis.
Local Request History
The interface includes request history for previous lookups.
Regularly Updated Data
Data is updated regularly through internal systems and public databases.
🧾 Results Table
The detailed results table provides field-by-field explanations.
Typical fields include:
| Field | Meaning |
|---|---|
| Continent | Geographic continent |
| Continent code | Short continent identifier |
| Country | Country name |
| Country code | ISO country code |
| Region code | State or region abbreviation |
| Region name | Full state or region |
| City | City name |
| District | District, if available |
| Postal code | Postal code, if available |
| Latitude | Approximate latitude |
| Longitude | Approximate longitude |
| Time zone | Timezone name |
| Offset UTC | UTC offset |
| Currency | Local currency |
| ISP | Internet service provider |
| Organization | Owning or related organization |
| AS | Autonomous System |
| AS Name | AS network name |
| Reverse DNS | PTR hostname |
| Mobile Network | Mobile network indicator |
| Proxy | Proxy indicator |
| Hosting | Hosting / cloud / data center indicator |
| Requested | Original query |
| HTTP Code | Lookup response code |
| Source | Data source identifier |
The table is useful for copying values into reports, incident notes, or enrichment workflows.
🔍 Common Use Cases
IP / Domain Explorer can support many legitimate workflows.
SOC Triage
Quickly enrich suspicious IPs from alerts, logs, SIEM events, or EDR telemetry.
Threat Intelligence
Identify ASN, organization, and hosting flags for IPs connected to suspicious infrastructure.
Fraud Analysis
Check whether a user IP appears to be a proxy, hosting provider, or mobile network.
Access Review
Compare login IP geolocation with expected user location.
Infrastructure Audit
Check how owned domains or IPs appear in public geolocation and network databases.
Abuse Reporting
Identify the responsible ISP or ASN before submitting abuse reports.
OSINT Investigation
Enrich IPs and domains during lawful public-source investigations.
Compliance and Risk Review
Document regional and infrastructure attributes of network indicators.
🧠 Result Interpretation
IP and domain intelligence should be interpreted carefully.
Important notes:
-
IP geolocation is approximate.
-
Hosting and proxy flags are indicators, not proof.
-
Reverse DNS may be missing or outdated.
-
Domains may resolve to CDN or cloud infrastructure.
-
CDN IPs may represent provider edge locations, not the real origin server.
-
Mobile and proxy classifications may vary by data source.
-
ASN identifies network ownership, not necessarily the person or organization using the service.
-
A domain may use different IPs over time.
-
Results should be correlated with logs, DNS records, threat intelligence, and internal context.
The tool is best used as an enrichment layer, not as a single source of truth.
✅ Recommended Analyst Workflow
A practical workflow should follow these steps.
1. Enter the IP or Domain
Use a clean IPv4 address, IPv6 address, or domain name.
2. Review Location
Check country, region, city, coordinates, timezone, and map.
3. Review Network Ownership
Check ISP, organization, ASN, and AS name.
4. Check Flags
Look for hosting, proxy, or mobile network indicators.
5. Review Reverse DNS
Use PTR data to understand service naming or provider context.
6. Compare With Logs
Correlate the lookup result with timestamps, user activity, SIEM events, or application logs.
7. Avoid Overclaiming
Do not treat geolocation as exact physical attribution.
8. Document Findings
Use the field table in reports or case notes when appropriate.
9. Repeat if DNS Changes
For domains, repeat the lookup if DNS records may have changed.
10. Validate Critical Conclusions
Use additional sources before making security, compliance, or legal decisions.
🛡️ Security, Privacy & Responsible Use
IP / Domain Explorer is intended for lawful network intelligence, cybersecurity, troubleshooting, and OSINT enrichment.
Acceptable use cases include:
-
Checking your own IP or domain
-
Enriching security logs
-
Investigating suspicious IPs
-
Reviewing infrastructure ownership
-
Fraud and abuse analysis
-
Network troubleshooting
-
SOC triage
-
Threat intelligence enrichment
-
Compliance reporting
-
Domain and DNS investigation
Users should follow responsible use rules:
-
Do not use geolocation data for stalking, harassment, or physical targeting.
-
Do not claim exact personal location from IP geolocation.
-
Do not use proxy or hosting flags as final proof of wrongdoing.
-
Do not harass network owners or abuse contacts based on weak indicators.
-
Validate important findings with additional evidence.
-
Treat local lookup history as potentially sensitive on shared devices.
-
Use the tool only for lawful and ethical analysis.
⚙️ Technical Highlights
-
IP and domain intelligence lookup
-
Available at
dash.niamonx.io/ipexplorer -
Supports IPv4
-
Supports IPv6
-
Supports domains
-
Supports IDN domains in Unicode
-
Uses internal systems and public databases
-
Returns continent, country, region, city, district, and postal code
-
Provides latitude and longitude
-
Map link for coordinates
-
Timezone and UTC offset
-
Currency enrichment
-
ISP and organization
-
Autonomous System Number
-
AS name
-
Reverse DNS
-
Proxy indicator
-
Hosting indicator
-
Mobile network indicator
-
HTTP response code
-
Source field
-
Request history
-
Regularly updated data
-
Suitable for SOC, OSINT, fraud analysis, network troubleshooting, and infrastructure review
📌 Usage Hints
-
Enter only an IP address or domain name.
-
Do not enter full URLs or paths.
-
Use IPv4 or IPv6 for direct IP lookup.
-
Use domain lookup when you need resolved network context.
-
Treat geolocation as approximate.
-
Check ASN and organization for network ownership.
-
Use hosting and proxy flags as indicators, not final proof.
-
Review reverse DNS for additional context.
-
For CDN-backed domains, remember that the IP may belong to the CDN, not the origin server.
-
Correlate results with logs and other intelligence sources.
-
Use the tool responsibly; data is updated regularly.
📬 Contact Information
For technical, legal, abuse, privacy, or support-related inquiries, users can contact the NiamonX team directly:
support@niamonx.io — Technical Support
other@niamonx.io — General Inquiries
takedown@niamonx.io — Privacy or Data Removal Requests
legal@niamonx.io — Legal and Compliance Matters
Alternative contact channel:
🔗 Helpdesk: https://support.niamonx.io/
Summary
NiamonX IP / Domain Explorer is a fast IP and domain intelligence tool for checking geolocation, ASN, ISP, organization, reverse DNS, proxy status, hosting status, mobile network status, timezone, currency, and related network metadata.
It supports IPv4, IPv6, standard domains, and Unicode IDN domains. The tool is designed for SOC triage, OSINT enrichment, fraud analysis, infrastructure review, network troubleshooting, and compliance workflows. Results should be interpreted as contextual intelligence and validated with additional sources when used for important decisions.
GlobeLine Ping | High-Level IP Availability & RTT Check
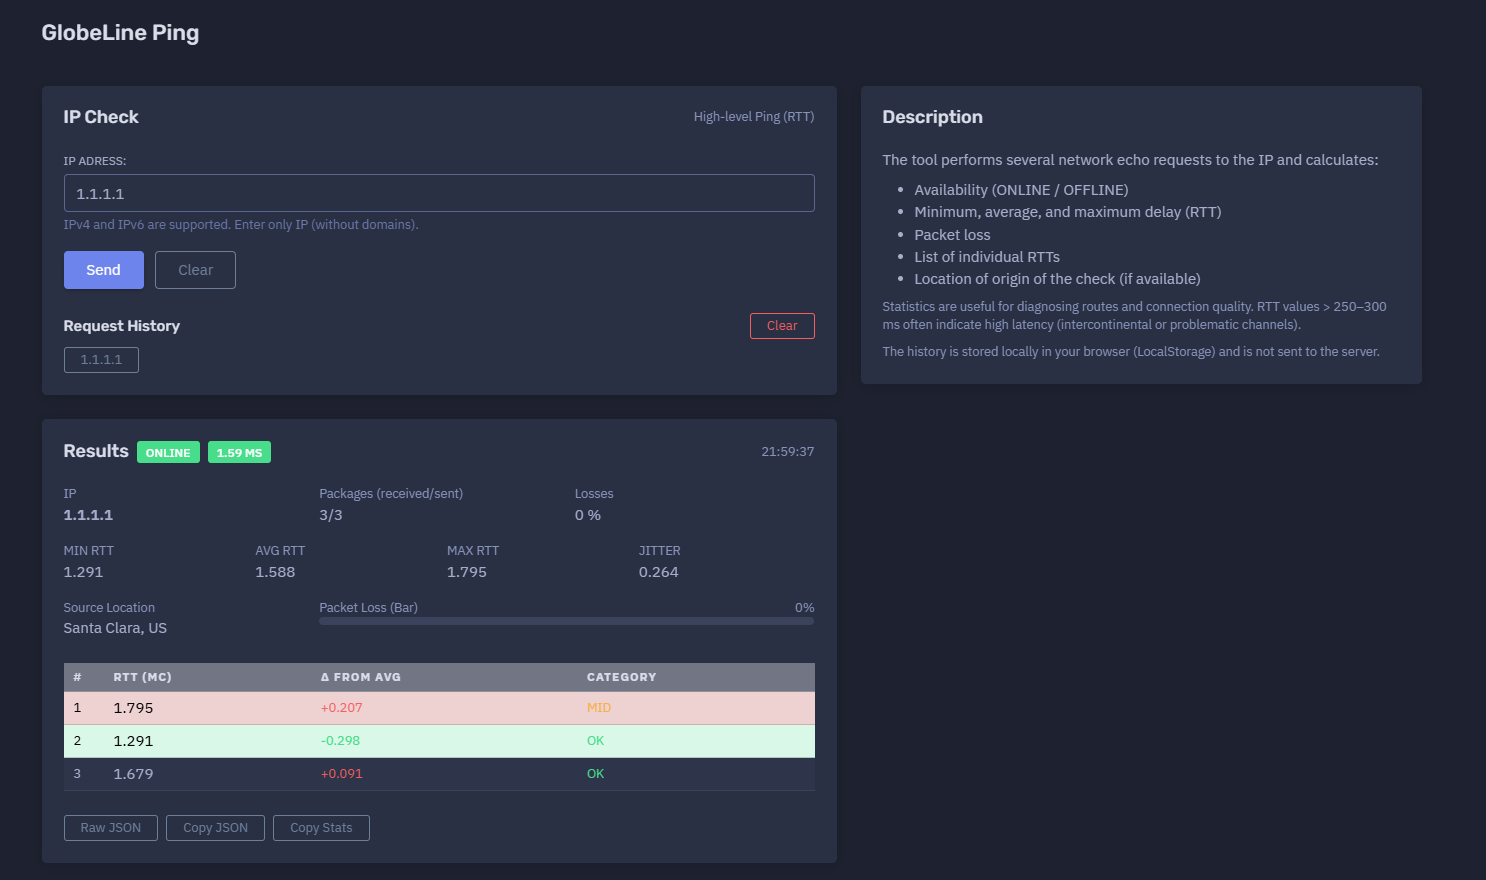
The platform available at https://dash.niamonx.io/gl_ping — known as GlobeLine Ping — is a high-level network availability and latency diagnostic tool within the NiamonX platform. It allows users to check whether an IPv4 or IPv6 address is reachable and measure connection quality through network echo requests.
Overview of the Service
GlobeLine Ping is designed to provide a fast and clear health check for an IP address. The tool sends several network echo requests to the selected IP and calculates key network quality metrics, including availability, packet loss, minimum latency, average latency, maximum latency, jitter, and individual RTT values.
The tool is useful for system administrators, SOC analysts, DevOps engineers, network engineers, infrastructure owners, cybersecurity teams, and technical users who need to quickly verify whether a host is online and how stable the connection is from the checking location.
GlobeLine Ping is a high-level diagnostic utility. It does not perform port scanning, service enumeration, exploitation, or deep packet inspection. It only checks reachability and latency characteristics for the submitted IP address.
🔍 How the Tool Works
When a user enters an IPv4 or IPv6 address, GlobeLine Ping sends several network echo requests from the NiamonX checking infrastructure.
The tool then calculates and displays:
-
Availability status
-
Number of packets sent
-
Number of packets received
-
Packet loss percentage
-
Minimum RTT
-
Average RTT
-
Maximum RTT
-
Jitter
-
Individual RTT values
-
Difference from average latency
-
RTT quality category
-
Source location of the check, when available
Example result summary:
ONLINE
1.59 ms
Packets: 3/3
Losses: 0%
MIN RTT: 1.291 ms
AVG RTT: 1.588 ms
MAX RTT: 1.795 ms
JITTER: 0.264 ms
Source Location: Santa Clara, US
This gives the user a quick understanding of whether the IP is reachable and whether the connection appears stable.
🧩 What Can Be Checked
GlobeLine Ping supports direct IP address checks.
Supported input types:
-
IPv4 address
-
IPv6 address
Examples:
1.1.1.1
8.8.8.8
2606:4700:4700::1111
Unsupported input types:
example.com
https://example.com
1.1.1.1:443
example.com/path
The tool expects only a clean IPv4 or IPv6 address. Domains and URLs are not accepted in this module.
⚙️ Search Interface
The interface contains a simple IP input field.
IP Address
The user enters the target IP address.
Example:
1.1.1.1
The interface states that IPv4 and IPv6 are supported and that the user should enter only the IP address, without domains or URLs.
After the check is completed, GlobeLine Ping displays the result status, summary metrics, packet statistics, RTT table, and source location.
📊 Result Overview
The main result panel gives a fast status summary.
Possible status values:
| Status | Meaning |
|---|---|
| ONLINE | The IP responded to the network echo requests |
| OFFLINE | The IP did not respond or could not be reached |
| UNKNOWN | The result could not be confidently determined |
Example:
ONLINE
1.59 ms
The large latency value shown next to the status usually represents the average RTT or primary response time.
📦 Packet Statistics
The tool displays packet delivery statistics.
Example:
Packages received/sent: 3/3
Losses: 0%
Received / Sent
Shows how many echo responses were received compared to how many requests were sent.
Example:
3/3
This means all three requests received responses.
Packet Loss
Packet loss shows the percentage of requests that did not receive a response.
Example:
0%
Packet loss is one of the most important indicators of connection reliability.
⏱️ RTT Metrics
RTT means Round-Trip Time. It measures how long it takes for a request to reach the target and for the response to return.
GlobeLine Ping calculates several RTT values.
Minimum RTT
The fastest response time observed during the check.
Example:
MIN RTT: 1.291 ms
Average RTT
The average response time across all received packets.
Example:
AVG RTT: 1.588 ms
Maximum RTT
The slowest response time observed during the check.
Example:
MAX RTT: 1.795 ms
Together, these values help users understand the connection’s speed and stability.
📉 Jitter
Jitter measures variation between response times.
Example:
JITTER: 0.264 ms
Low jitter means responses are consistent.
High jitter means latency is unstable, which may indicate:
-
Network congestion
-
Routing instability
-
Wireless interference
-
Provider-level issues
-
Intercontinental routing
-
Packet scheduling delays
-
Saturated links
-
Temporary infrastructure problems
Jitter is especially important for real-time services such as VoIP, video calls, gaming, remote desktops, and streaming.
🌍 Source Location
The result may include the source location of the check.
Example:
Source Location: Santa Clara, US
This tells the user where the ping check was performed from.
Source location matters because latency depends strongly on distance and routing. A target may respond quickly from one region and slowly from another.
For example:
-
A US server may respond quickly from a US checking node.
-
The same server may show higher latency from Europe or Asia.
-
CDN and anycast services may route users to different nearby nodes.
📊 Individual RTT Table
GlobeLine Ping displays individual packet measurements.
Example table:
| # | RTT ms | Δ from AVG | Category |
|---|---|---|---|
| 1 | 1.795 | +0.207 | MID |
| 2 | 1.291 | -0.298 | OK |
| 3 | 1.679 | +0.091 | OK |
RTT
The measured round-trip time for each individual request.
Δ from AVG
Shows how far the individual RTT differs from the average RTT.
Positive values mean the packet was slower than average.
Negative values mean the packet was faster than average.
Category
A simple quality label for the individual response.
Possible labels may include:
-
OK
-
MID
-
SLOW
-
LOST
-
ERROR
The exact label depends on the tool’s internal classification logic.
📶 Packet Loss Bar
The packet loss bar visualizes the percentage of lost packets.
Example:
Packet Loss: 0%
Interpretation:
| Packet Loss | Meaning |
|---|---|
| 0% | Excellent packet delivery |
| 1–2% | Minor loss, usually acceptable but worth watching |
| 3–5% | Noticeable instability |
| 5–10% | Significant network quality issue |
| 10%+ | Serious connectivity problem |
Even small packet loss can affect real-time applications.
🧠 Latency Interpretation
RTT values depend on distance, routing, network congestion, and target infrastructure.
General interpretation:
| Average RTT | Interpretation |
|---|---|
| 0–20 ms | Very low latency |
| 20–60 ms | Good latency |
| 60–120 ms | Moderate latency |
| 120–250 ms | High but often normal for long-distance routing |
| 250–300+ ms | Very high latency, often intercontinental or problematic |
| Timeout / no response | Host may be offline, filtered, or blocking echo requests |
RTT values above 250–300 ms often indicate intercontinental routing, unstable paths, overloaded networks, or problematic channels.
Important: a high RTT does not always mean the target is broken. It may simply be far away or routed through a distant network path.
🧠 Key Features
IP Availability Check
The tool determines whether an IP address appears reachable.
IPv4 and IPv6 Support
Both modern IPv4 and IPv6 targets are supported.
High-Level Ping
The tool performs several echo requests and calculates summary statistics.
RTT Measurement
Minimum, average, and maximum round-trip time are displayed.
Packet Loss Calculation
The tool shows packet delivery success and loss percentage.
Jitter Calculation
Latency variation is calculated to help evaluate connection stability.
Individual Packet Details
Each request is listed with RTT, difference from average, and quality category.
Source Location
The origin location of the check is shown when available.
Local Request History
Search history is stored locally in the browser through LocalStorage.
Lightweight Diagnostic Design
The tool is simple, fast, and focused on availability and latency rather than deep service analysis.
🕓 Request History
GlobeLine Ping stores request history locally in the user’s browser.
Important behavior:
The history is stored locally in your browser and is not sent to the server.
History may include:
-
Checked IP address
-
Result status
-
Average RTT
-
Packet loss
-
Timestamp
-
Source location, when available
Because history is local, it may be cleared if the user clears browser data, switches devices, or uses another browser profile.
✅ Recommended Diagnostic Workflow
A practical troubleshooting workflow should follow these steps.
1. Enter the IP Address
Use only IPv4 or IPv6. Do not enter a domain, URL, port, or path.
2. Check Availability
Look at the main status: ONLINE or OFFLINE.
3. Review Packet Loss
If packet loss is above 0%, repeat the test and compare results.
4. Review RTT Values
Check minimum, average, and maximum RTT.
5. Review Jitter
High jitter may indicate unstable routing or network congestion.
6. Check Individual Packets
Look for spikes, inconsistent values, or lost responses.
7. Consider Source Location
Compare the source region with the target’s expected location.
8. Repeat From Other Tools if Needed
If the result is critical, verify from another network or monitoring system.
9. Correlate With Other Signals
Use logs, traceroute, service checks, uptime monitoring, firewall rules, and provider status pages to confirm the issue.
10. Document the Result
Use the metrics in incident notes or troubleshooting reports.
🔎 Common Use Cases
GlobeLine Ping can support many technical workflows.
Server Availability Check
Quickly confirm whether a server IP responds.
Network Troubleshooting
Check whether latency or packet loss is affecting connectivity.
Incident Response
Verify if an IP is reachable during outage investigation.
Route Quality Review
Use RTT and jitter as a first indicator of network path quality.
Infrastructure Monitoring
Perform quick spot checks on public infrastructure.
CDN and Anycast Testing
Compare response behavior from the tool’s source location.
Firewall Validation
Determine whether ICMP-style echo requests are allowed or blocked.
ISP or Hosting Issue Review
Use packet loss and RTT data as basic evidence for support tickets.
⚠️ Result Interpretation Notes
Ping results should be interpreted carefully.
Important limitations:
-
Some hosts block ICMP or echo requests.
-
OFFLINE does not always mean the service is down.
-
A web server may be online even if ping is blocked.
-
Firewalls may drop echo requests.
-
Packet loss can be temporary.
-
RTT depends on distance and routing.
-
Source location affects latency.
-
Anycast IPs may route to different nodes from different regions.
-
A small sample size gives a quick check, not long-term monitoring.
For critical systems, use additional checks such as TCP connection tests, HTTP status checks, traceroute, DNS checks, and continuous monitoring.
🛡️ Security, Privacy & Responsible Use
GlobeLine Ping is intended for lawful network diagnostics and infrastructure monitoring.
Acceptable use cases include:
-
Checking your own servers
-
Testing authorized infrastructure
-
Verifying network reachability
-
Diagnosing latency and packet loss
-
Supporting incident response
-
Troubleshooting routing issues
-
Monitoring public service availability
-
Creating basic network reports
Users should follow responsible use principles:
-
Do not use the tool to harass or overload third-party systems.
-
Do not repeatedly test targets without a legitimate reason.
-
Do not treat ping failure as proof of compromise or outage.
-
Do not use results as the only source for critical operational decisions.
-
Respect applicable laws and network policies.
-
Treat local history as potentially sensitive on shared devices.
⚙️ Technical Highlights
-
High-level IP ping tool
-
Available at
dash.niamonx.io/gl_ping -
Supports IPv4
-
Supports IPv6
-
IP-only input
-
No domains or URLs accepted
-
Availability status: ONLINE / OFFLINE
-
Multiple echo requests per check
-
Packets received / sent
-
Packet loss percentage
-
Minimum RTT
-
Average RTT
-
Maximum RTT
-
Jitter calculation
-
Individual RTT table
-
Delta from average RTT
-
Quality category per packet
-
Packet loss visualization
-
Source location display when available
-
Local browser history through LocalStorage
-
History is not sent to the server
-
Suitable for network diagnostics, infrastructure checks, SOC workflows, DevOps, and troubleshooting
📌 Usage Hints
-
Enter only an IPv4 or IPv6 address.
-
Do not enter domains, URLs, ports, or paths.
-
ONLINE means the IP responded to the echo requests.
-
OFFLINE may also mean ICMP is blocked.
-
Check packet loss before judging connection quality.
-
Compare MIN, AVG, and MAX RTT for latency stability.
-
Use jitter to identify unstable connections.
-
RTT above 250–300 ms usually indicates high-latency routing.
-
Repeat the check if results are inconsistent.
-
Consider the source location when interpreting latency.
-
Use other diagnostics for critical systems.
-
Local history stays in the browser and is not sent to the server.
📬 Contact Information
For technical, legal, abuse, privacy, or support-related inquiries, users can contact the NiamonX team directly:
support@niamonx.io — Technical Support
other@niamonx.io — General Inquiries
takedown@niamonx.io — Privacy or Data Removal Requests
legal@niamonx.io — Legal and Compliance Matters
Alternative contact channel:
🔗 Helpdesk: https://support.niamonx.io/
Summary
NiamonX GlobeLine Ping is a high-level IP availability and latency diagnostic tool for IPv4 and IPv6 addresses. It sends several network echo requests, determines whether the target is online, and calculates packet loss, minimum RTT, average RTT, maximum RTT, jitter, individual response times, and source location.
The tool is designed for lawful network diagnostics, infrastructure monitoring, DevOps workflows, SOC triage, and incident response. Results should be interpreted as quick network health indicators and confirmed with additional diagnostics when used for critical decisions.
GeoPing | Multi-Location IP Availability & Latency Check
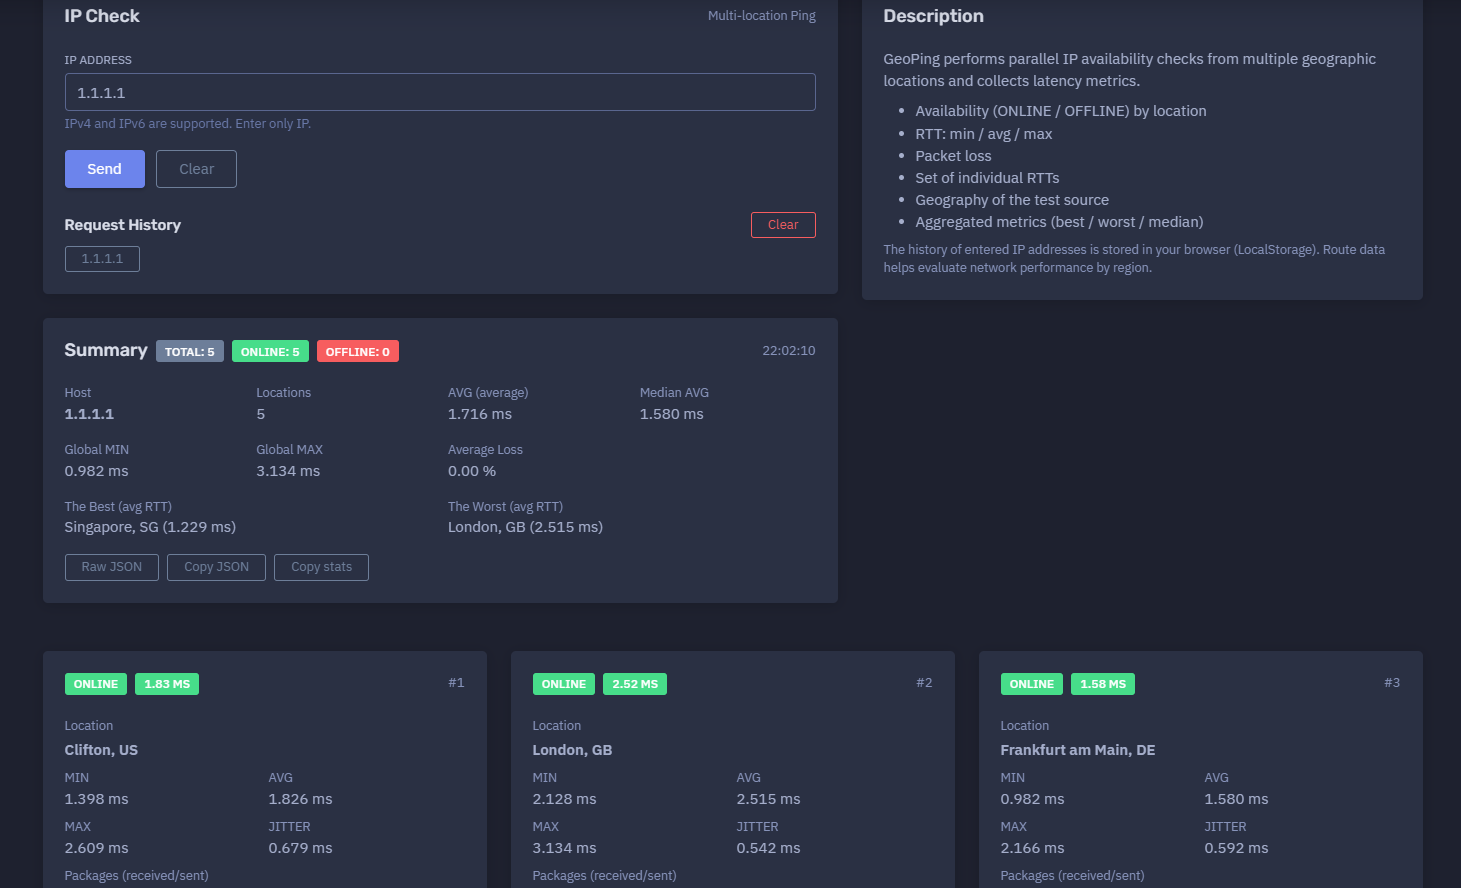
The platform available at https://dash.niamonx.io/geoping — known as GeoPing — is a multi-location network diagnostic tool within the NiamonX platform. It allows users to check IPv4 and IPv6 availability from several geographic locations at the same time and compare latency, packet loss, jitter, and route quality by region.
Overview of the Service
GeoPing is designed to help users understand how reachable and responsive an IP address is from different parts of the world.
Unlike a single-location ping test, GeoPing performs parallel checks from multiple geographic nodes and aggregates the results into a structured report. This makes it useful for identifying regional connectivity differences, routing problems, CDN behavior, network instability, and global availability issues.
The tool is intended for network engineers, DevOps teams, SOC analysts, system administrators, infrastructure owners, hosting providers, cybersecurity teams, and technical users who need to evaluate IP-level connectivity from several locations.
GeoPing supports:
-
IPv4 addresses
-
IPv6 addresses
-
Multi-location availability checks
-
Regional RTT comparison
-
Packet loss analysis
-
Jitter measurement
-
Best / worst location detection
-
Median and average latency metrics
-
Local browser-based request history
The tool accepts only IP addresses. Domains, URLs, ports, and paths are not supported in this module.
🔍 How the Tool Works
When a user enters an IPv4 or IPv6 address, GeoPing launches parallel availability checks from several geographic locations.
Each location sends multiple network echo requests to the target IP. The tool then calculates per-location metrics and global aggregated statistics.
The result includes:
-
Overall number of test locations
-
Number of online locations
-
Number of offline locations
-
Average RTT across locations
-
Median average RTT
-
Global minimum RTT
-
Global maximum RTT
-
Average packet loss
-
Best location by average RTT
-
Worst location by average RTT
-
Per-location availability status
-
Per-location minimum, average, and maximum RTT
-
Per-location jitter
-
Packets received / sent
-
Packet loss percentage
-
Individual RTT values
Example summary:
Total: 5
ONLINE: 5
OFFLINE: 0
Host: 1.1.1.1
Locations: 5
AVG: 1.716 ms
Median AVG: 1.580 ms
Global MIN: 0.982 ms
Global MAX: 3.134 ms
Average Loss: 0.00%
Best: Singapore, SG
Worst: London, GB
This allows users to quickly understand whether the IP is globally reachable and whether any region has unusual latency or packet loss.
🧩 What Can Be Checked
GeoPing supports direct IP address checks.
Supported input types:
-
IPv4 address
-
IPv6 address
Valid examples:
1.1.1.1
8.8.8.8
2606:4700:4700::1111
Unsupported input examples:
example.com
https://example.com
1.1.1.1:443
example.com/path
GeoPing expects only a clean IPv4 or IPv6 address.
⚙️ Check Interface
The GeoPing interface contains a simple input field and result sections.
IP Address
The user enters the target IP address.
Example:
1.1.1.1
The interface indicates that IPv4 and IPv6 are supported and that only an IP address should be entered.
After the request is processed, the tool displays:
-
Summary block
-
Per-location result cards
-
Individual RTT lists
-
Packet loss values
-
Request history
📊 Summary Section
The Summary section provides a global view of the test.
Typical fields include:
| Field | Description |
|---|---|
| Total | Total number of locations used for the test |
| ONLINE | Number of locations where the IP responded |
| OFFLINE | Number of locations where the IP did not respond |
| Host | Checked IP address |
| Locations | Number of geographic test sources |
| AVG | Average latency across test locations |
| Median AVG | Median of per-location average RTT values |
| Global MIN | Lowest RTT measured across all packets and locations |
| Global MAX | Highest RTT measured across all packets and locations |
| Average Loss | Average packet loss across all locations |
| Best | Location with the lowest average RTT |
| Worst | Location with the highest average RTT |
Example:
ONLINE: 5
OFFLINE: 0
AVG: 1.716 ms
Average Loss: 0.00%
Best: Singapore, SG
Worst: London, GB
This block helps users quickly identify whether the target is reachable globally and which regions have the best or worst connectivity.
🌍 Multi-Location Testing
GeoPing runs checks from multiple geographic locations.
Example locations may include:
-
Clifton, US
-
London, GB
-
Frankfurt am Main, DE
-
Amsterdam, NL
-
Singapore, SG
Each location has its own result card showing availability and latency metrics.
This is useful because network performance can vary significantly by region.
For example:
-
A target may be fast from Europe but slow from Asia.
-
A CDN or anycast IP may route each region to a nearby node.
-
A firewall may allow traffic from one region but block another.
-
A routing issue may affect only one geography.
-
A hosting provider may have regional packet loss.
✅ Availability Status
Each location returns an availability status.
Common statuses:
| Status | Meaning |
|---|---|
| ONLINE | The IP responded from that location |
| OFFLINE | No response was received from that location |
| UNKNOWN | The result could not be confidently determined |
Example:
ONLINE
1.83 ms
Location: Clifton, US
If the IP is online from some regions and offline from others, this may indicate routing filters, regional firewall rules, DDoS protection behavior, provider issues, or temporary network problems.
⏱️ RTT Metrics
RTT means Round-Trip Time. It measures how long a packet takes to travel from the test location to the target IP and back.
Each location card may include:
-
MIN RTT
-
AVG RTT
-
MAX RTT
-
JITTER
-
RTT list
Example:
Location: Frankfurt am Main, DE
MIN: 0.982 ms
AVG: 1.580 ms
MAX: 2.166 ms
JITTER: 0.592 ms
Packets: 3/3
Losses: 0%
Minimum RTT
The fastest response observed from that location.
Average RTT
The average response time from that location.
Maximum RTT
The slowest response observed from that location.
RTT List
The individual response times for each packet.
Example:
RTT list: 1.250, 1.188, 1.250
📉 Jitter
Jitter measures the variation between individual RTT values.
Low jitter means the connection is stable.
High jitter may indicate:
-
Network congestion
-
Routing instability
-
Provider-level issues
-
Packet scheduling delays
-
Wireless or last-mile problems
-
Intercontinental routing instability
-
Saturated links
-
Temporary packet queuing
Example:
JITTER: 0.036 ms
A low jitter value is especially important for real-time applications such as VoIP, video calls, gaming, streaming, remote desktops, and interactive services.
📦 Packet Loss
Packet loss shows how many requests failed compared to how many were sent.
Example:
Packages received/sent: 3/3
Losses: 0%
Packet loss interpretation:
| Packet Loss | Meaning |
|---|---|
| 0% | Excellent delivery |
| 1–2% | Minor loss, usually acceptable but should be monitored |
| 3–5% | Noticeable instability |
| 5–10% | Significant network problem |
| 10%+ | Severe connectivity issue |
Packet loss from one region but not others may indicate a regional routing problem or filtering issue.
🏆 Best and Worst Locations
GeoPing automatically identifies the best and worst locations by average RTT.
Example:
The Best: Singapore, SG (1.229 ms)
The Worst: London, GB (2.515 ms)
Best Location
The location with the lowest average RTT.
This usually indicates the shortest or most efficient route from the test source to the target.
Worst Location
The location with the highest average RTT.
This may indicate longer routing distance, less efficient routing, congestion, filtering, or provider-level latency.
The best and worst labels are comparative within the current test, not absolute judgments of the target infrastructure.
📊 Aggregated Metrics
GeoPing includes global aggregated metrics across all locations.
Global Average
Shows the overall average latency across test sources.
Median Average
Shows the median of per-location average RTT values.
Median is useful because it is less affected by one unusually slow or fast location.
Global Minimum
Shows the fastest observed response from all locations.
Global Maximum
Shows the slowest observed response from all locations.
Average Loss
Shows the average packet loss across all test locations.
These metrics help users understand global route quality at a glance.
🧠 Latency Interpretation
Latency depends on geography, routing, peering, infrastructure, congestion, and target configuration.
General RTT interpretation:
| Average RTT | Interpretation |
|---|---|
| 0–20 ms | Very low latency |
| 20–60 ms | Good latency |
| 60–120 ms | Moderate latency |
| 120–250 ms | High latency |
| 250–300+ ms | Very high latency, often intercontinental or problematic |
| Timeout | No response, filtering, or target unavailable |
Important: low latency from multiple regions may indicate anycast routing, CDN edge infrastructure, or globally distributed network design.
High latency from one region may not mean the target is down. It may simply reflect distance, routing path, or provider differences.
🛰️ Anycast and CDN Interpretation
GeoPing is especially useful for checking anycast and CDN-style infrastructure.
For anycast services, the same IP address can be routed to different physical or logical locations depending on where the request originates.
This can explain why an IP may show very low latency from multiple regions at the same time.
Possible interpretations:
-
Anycast routing is working efficiently.
-
CDN edge nodes are close to the test sources.
-
DNS resolver or public service infrastructure is distributed.
-
Each region may reach a different backend node.
-
One region may be affected by routing or peering issues while others are healthy.
GeoPing does not prove the exact physical destination server. It shows observed connectivity from each test source.
🕓 Request History
GeoPing stores entered IP addresses in the user’s browser through LocalStorage.
Important behavior:
The history of entered IP addresses is stored in your browser.
History may include:
-
Checked IP address
-
Timestamp
-
Summary status
-
Average RTT
-
Best / worst locations
-
Packet loss values
The history is local to the browser and may be cleared when the user deletes browser data, switches devices, or uses another browser profile.
🧠 Key Features
Multi-Location Ping
Checks the same IP address from multiple geographic test sources.
IPv4 and IPv6 Support
Supports both IPv4 and IPv6 targets.
Parallel Availability Checks
Runs availability checks across several regions.
Per-Location Results
Each location shows status, RTT metrics, jitter, packets, loss, and RTT list.
Aggregated Summary
Shows global metrics such as average RTT, median, global min, global max, and average loss.
Best / Worst Location Detection
Automatically identifies the fastest and slowest test locations by average RTT.
Packet Loss Analysis
Displays packet loss per location and average loss globally.
Jitter Measurement
Shows latency stability for each geographic source.
Local History
Stores entered IPs locally in the browser.
Regional Route Insight
Helps compare network performance by geography.
✅ Recommended Diagnostic Workflow
A practical GeoPing workflow should follow these steps.
1. Enter the IP Address
Use only IPv4 or IPv6. Do not enter domains, URLs, ports, or paths.
2. Review Global Summary
Check total locations, online count, offline count, average RTT, median RTT, and average packet loss.
3. Identify Best and Worst Locations
Compare the fastest and slowest regions.
4. Review Per-Location Cards
Check each location’s minimum, average, maximum RTT, jitter, and packet loss.
5. Look for Regional Problems
Identify locations with high RTT, high jitter, packet loss, or offline status.
6. Compare With Expected Geography
Consider whether the target is expected to be close to the fastest region.
7. Repeat if Needed
Run another check if the issue appears temporary or inconsistent.
8. Correlate With Other Tools
Use traceroute, HTTP checks, DNS checks, CDN monitoring, firewall logs, and provider status pages for deeper analysis.
9. Document Findings
Use the summary and per-location metrics in troubleshooting reports or incident notes.
10. Validate Critical Issues
Confirm important outages or routing problems with additional monitoring sources.
🔎 Common Use Cases
GeoPing can support many technical workflows.
Global Availability Check
Confirm whether an IP is reachable from multiple regions.
CDN and Anycast Testing
Check how an anycast IP behaves from different geographic sources.
Regional Routing Diagnostics
Identify whether latency or packet loss affects specific regions.
Incident Response
Quickly determine whether an outage is global or region-specific.
Hosting Provider Comparison
Compare responsiveness of infrastructure from different test locations.
Network Performance Review
Evaluate latency consistency and jitter across regions.
Firewall and Filtering Validation
Check whether an IP responds from some countries but not others.
SLA and Monitoring Support
Use multi-location metrics as supporting evidence for service-quality review.
⚠️ Result Interpretation Notes
GeoPing results should be interpreted carefully.
Important limitations:
-
Some hosts block echo requests.
-
Offline from one region does not always mean the service is down.
-
A host can serve HTTP traffic even if ping is blocked.
-
Firewalls may treat test locations differently.
-
Anycast IPs may route each location to a different node.
-
RTT depends on distance, routing, and provider peering.
-
Small packet samples provide a quick diagnostic snapshot, not long-term monitoring.
-
Local or regional congestion may affect results temporarily.
-
GeoPing does not identify the exact physical server behind an anycast IP.
For critical production systems, GeoPing should be combined with continuous monitoring and application-level checks.
🛡️ Security, Privacy & Responsible Use
GeoPing is intended for lawful network diagnostics and infrastructure monitoring.
Acceptable use cases include:
-
Checking your own servers
-
Testing authorized infrastructure
-
Reviewing regional availability
-
Diagnosing packet loss
-
Measuring latency and jitter
-
Supporting incident response
-
Monitoring CDN and anycast behavior
-
Validating firewall and routing behavior
-
Creating troubleshooting reports
Users should follow responsible use principles:
-
Do not use the tool to harass or overload third-party systems.
-
Do not repeatedly test targets without a legitimate reason.
-
Do not treat ping failure as proof of full service outage.
-
Do not use results as the only source for critical operational decisions.
-
Respect applicable laws and network policies.
-
Treat local history as potentially sensitive on shared devices.
⚙️ Technical Highlights
-
Multi-location IP ping tool
-
Available at
dash.niamonx.io/geoping -
Supports IPv4
-
Supports IPv6
-
IP-only input
-
No domains or URLs accepted
-
Parallel checks from multiple geographic locations
-
Availability status by location
-
Global ONLINE / OFFLINE summary
-
Minimum RTT per location
-
Average RTT per location
-
Maximum RTT per location
-
Jitter per location
-
Packets received / sent
-
Packet loss per location
-
Individual RTT list
-
Global average RTT
-
Median average RTT
-
Global minimum RTT
-
Global maximum RTT
-
Average packet loss
-
Best location by average RTT
-
Worst location by average RTT
-
Source geography display
-
LocalStorage request history
-
Suitable for network diagnostics, DevOps, SOC, incident response, CDN checks, and global availability monitoring
📌 Usage Hints
-
Enter only an IPv4 or IPv6 address.
-
Do not enter domains, URLs, ports, or paths.
-
Use the global summary to check overall availability.
-
Use per-location cards to identify regional issues.
-
Compare best and worst locations for route quality.
-
Check packet loss before judging reliability.
-
Check jitter to detect unstable latency.
-
High RTT may be normal for long-distance routing.
-
Offline from one region may indicate filtering, not full outage.
-
Repeat tests if the result is unexpected.
-
Use additional diagnostics for production incidents.
-
Local history is stored in the browser through LocalStorage.
📬 Contact Information
For technical, legal, abuse, privacy, or support-related inquiries, users can contact the NiamonX team directly:
support@niamonx.io — Technical Support
other@niamonx.io — General Inquiries
takedown@niamonx.io — Privacy or Data Removal Requests
legal@niamonx.io — Legal and Compliance Matters
Alternative contact channel:
🔗 Helpdesk: https://support.niamonx.io/
Summary
NiamonX GeoPing is a multi-location IP availability and latency diagnostic tool for IPv4 and IPv6 addresses. It performs parallel checks from several geographic locations and returns global availability, per-location RTT metrics, packet loss, jitter, individual response times, best and worst locations, median latency, and aggregated performance indicators.
The tool is designed for global availability checks, CDN and anycast validation, routing diagnostics, incident response, DevOps workflows, SOC triage, and infrastructure monitoring. Results should be treated as a regional network-performance snapshot and validated with additional diagnostics for critical decisions.
GlobeLine DNS | DNS Query & Record Intelligence
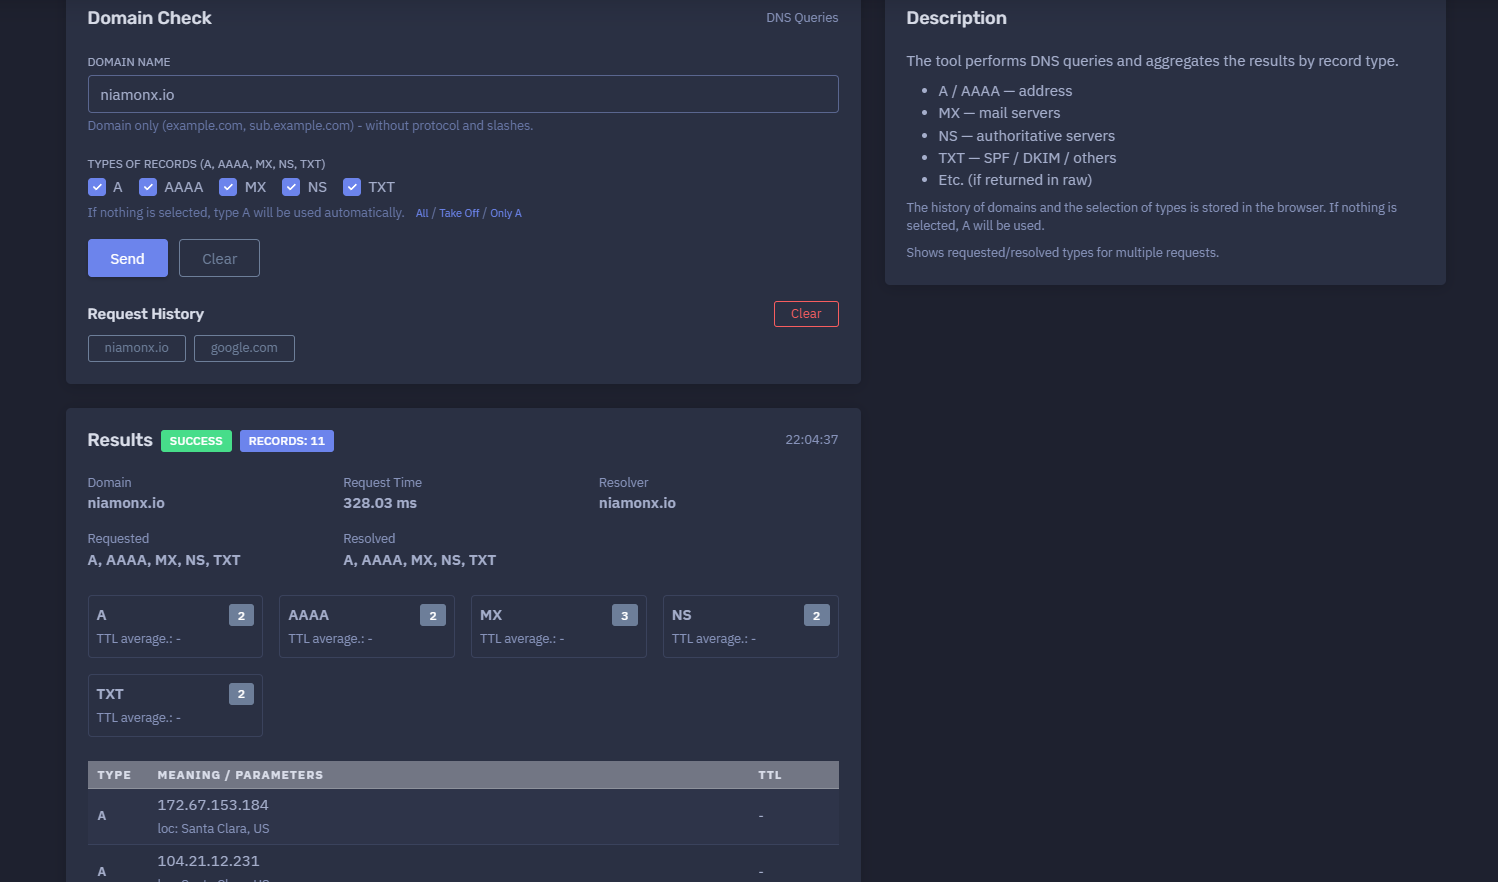
The platform available at https://dash.niamonx.io/gl_dns — known as GlobeLine DNS — is a DNS intelligence and domain record lookup tool within the NiamonX platform. It allows users to perform DNS queries for a domain name and aggregate the returned records by type, including A, AAAA, MX, NS, TXT, and other records when available in the raw response.
Overview of the Service
GlobeLine DNS is designed to help users quickly inspect DNS configuration for a domain or subdomain.
The tool performs DNS queries through the NiamonX resolver infrastructure and presents the results in a clean, structured format. It shows which record types were requested, which record types were resolved, how many records were found, request timing, resolver information, and individual DNS records grouped by type.
GlobeLine DNS is useful for:
-
Domain configuration review
-
DNS troubleshooting
-
Mail infrastructure checks
-
Security and SPF validation
-
OSINT enrichment
-
SOC triage
-
Infrastructure monitoring
-
Domain migration checks
-
Incident response
-
Technical documentation
The tool accepts domain names only. Users should enter a clean domain or subdomain without protocol, slashes, paths, or URL parameters.
🔍 How the Tool Works
When a user enters a domain name, GlobeLine DNS performs DNS queries for the selected record types.
Supported record types include:
-
A
-
AAAA
-
MX
-
NS
-
TXT
If no record type is selected, the tool automatically uses type A.
After the request is completed, the interface displays:
-
Query status
-
Number of returned records
-
Domain name
-
Request time
-
Resolver
-
Requested record types
-
Resolved record types
-
Count per record type
-
TTL information when available
-
Individual record values
-
Source location for returned records when available
-
Local browser request history
Example result summary:
SUCCESS
Records: 11
Domain: niamonx.io
Request Time: 328.03 ms
Requested: A, AAAA, MX, NS, TXT
Resolved: A, AAAA, MX, NS, TXT
🧩 What Can Be Checked
GlobeLine DNS supports domain and subdomain checks.
Valid examples:
example.com
sub.example.com
niamonx.io
Unsupported input examples:
https://example.com
example.com/path
https://example.com/login?x=1
1.1.1.1
The tool is intended for domain names only. IP lookup, ping, geolocation, and service discovery are handled by separate NiamonX modules.
⚙️ Query Interface
The GlobeLine DNS interface includes a domain input field and record type selection controls.
Domain Name
The user enters a domain or subdomain.
Example:
niamonx.io
The interface indicates:
Domain only — without protocol and slashes.
Types of Records
Users can select one or more DNS record types.
Available primary types:
-
A
-
AAAA
-
MX
-
NS
-
TXT
Quick controls may include:
-
All
-
Take Off
-
Only A
If nothing is selected, type A is used automatically.
📌 Supported Record Types
A Record
An A record maps a domain name to an IPv4 address.
Example:
A 172.67.153.184
A records are commonly used to route a domain to a web server, CDN edge, proxy, or hosting infrastructure.
AAAA Record
An AAAA record maps a domain name to an IPv6 address.
Example:
AAAA 2606:4700:3033::6815:ce7
AAAA records are used for IPv6-enabled services.
MX Record
An MX record identifies mail servers responsible for receiving email for the domain.
Example:
MX mx.zoho.eu.
MX records are important for checking whether email delivery is configured correctly.
NS Record
An NS record identifies authoritative name servers for the domain.
Example:
NS abdullah.ns.cloudflare.com.
NS records show which DNS provider or authoritative DNS infrastructure controls the domain zone.
TXT Record
A TXT record stores text-based DNS values.
Common uses include:
-
SPF policies
-
DKIM records
-
DMARC records
-
Site verification
-
Domain ownership verification
-
Security and service configuration
Example:
TXT v=spf1 include:zohomail.eu -all
TXT records are especially important for mail security and domain verification.
📊 Results Summary
After a successful query, the tool displays a summary block.
Typical fields include:
| Field | Description |
|---|---|
| Status | Query result status |
| Records | Total number of returned records |
| Domain | Queried domain |
| Request Time | Total DNS query duration |
| Resolver | Resolver or source used for the request |
| Requested | DNS record types requested by the user |
| Resolved | DNS record types successfully returned |
| Type counters | Number of records per type |
| TTL average | Average TTL per record type when available |
Example:
SUCCESS
Records: 11
Request Time: 328.03 ms
Resolver: niamonx.io
Requested: A, AAAA, MX, NS, TXT
Resolved: A, AAAA, MX, NS, TXT
This helps users quickly understand whether DNS resolution succeeded and which record types were returned.
📋 Results Table
DNS records are displayed in a structured table.
Typical columns include:
| Column | Description |
|---|---|
| Type | DNS record type |
| Meaning / Parameters | Returned DNS value |
| TTL | Time To Live value when available |
Example table rows:
A     172.67.153.184
AAAA  2606:4700:3033::6815:ce7
MX    mx.zoho.eu.
NS    abdullah.ns.cloudflare.com.
TXT   v=spf1 include:zohomail.eu -all
When available, the tool may also show resolver-side or source-location context for records.
Example:
loc: Santa Clara, US
⏱️ TTL Interpretation
TTL means Time To Live. It tells DNS resolvers how long they may cache a record before checking again.
A low TTL may indicate:
-
Active migration
-
Dynamic infrastructure
-
Load balancing changes
-
Failover preparation
-
Frequent DNS updates
A high TTL may indicate:
-
Stable DNS configuration
-
Lower DNS query volume
-
Longer propagation time after changes
-
TTL availability depends on the DNS response and backend resolver behavior.
📬 Mail Configuration Review
MX and TXT records are especially important for email security and delivery.
GlobeLine DNS can help review:
-
Mail servers
-
SPF records
-
DKIM records
-
DMARC records
-
Domain verification records
-
Third-party mail provider configuration
Example SPF record:
v=spf1 include:zohomail.eu -all
An SPF record defines which mail servers are authorized to send email for the domain.
Security teams can use TXT records to check whether the domain has proper anti-spoofing configuration.
🛡️ Security-Relevant DNS Checks
GlobeLine DNS can support several defensive security checks.
SPF Review
Check TXT records for SPF configuration.
Look for records starting with:
v=spf1
DKIM Review
Check for DKIM selector records when querying specific DKIM subdomains.
Example format:
selector._domainkey.example.com
DMARC Review
Check the DMARC policy by querying:
_dmarc.example.com
Name Server Review
Check NS records to confirm which provider controls authoritative DNS.
Address Review
Check A and AAAA records to confirm where the domain resolves.
Mail Provider Review
Check MX records to identify the active mail provider.
🌍 Resolver and Location Context
The results may include resolver or location context.
Example:
Resolver: niamonx.io
loc: Santa Clara, US
This helps users understand where the DNS request was resolved from or what infrastructure was used for the lookup.
DNS responses can vary by location due to:
-
GeoDNS
-
CDN routing
-
Anycast DNS
-
Split-horizon DNS
-
Resolver caching
-
Regional load balancing
-
DNS-based failover
For global infrastructure, results from one resolver location should be treated as one perspective.
🕓 Request History
GlobeLine DNS stores domain queries and selected record types in the browser.
The history may include:
-
Queried domain
-
Selected record types
-
Timestamp
-
Query status
-
Record count
-
Result summary
Important behavior:
The history of domains and the selection of types is stored in the browser.
Local history helps users repeat common DNS checks quickly.
🧠 Key Features
DNS Query Tool
Performs DNS queries for selected record types.
Domain and Subdomain Support
Accepts clean domain names and subdomains.
Multiple Record Types
Supports A, AAAA, MX, NS, and TXT.
Automatic A Fallback
If no type is selected, A is used automatically.
Aggregated Results
Groups returned data by DNS record type.
Requested vs Resolved Types
Shows which types were requested and which types returned results.
Request Timing
Displays DNS request duration.
TTL Display
Shows TTL values when available.
Resolver Context
Displays resolver/source information.
Local History
Stores domains and record type selections in the browser.
Security Review Support
Useful for SPF, MX, NS, and TXT-based security checks.
✅ Recommended Analyst Workflow
A practical DNS review workflow should follow these steps.
1. Enter a Clean Domain
Use only the domain or subdomain without protocol, slashes, or paths.
2. Select Record Types
Choose A, AAAA, MX, NS, TXT, or use All for a broader check.
3. Review Query Status
Confirm that the result status is SUCCESS.
4. Check Requested and Resolved Types
Verify whether the requested record types returned data.
5. Review Address Records
Check A and AAAA records for web or infrastructure routing.
6. Review Mail Records
Check MX records for mail server configuration.
7. Review TXT Records
Look for SPF, DKIM, DMARC, verification, and other security records.
8. Review Name Servers
Check NS records to identify authoritative DNS providers.
9. Consider Resolver Perspective
Remember that DNS responses can vary by geography, resolver, and cache state.
10. Document Findings
Use returned records in reports, migration notes, incident response, or security reviews.
🔎 Common Use Cases
GlobeLine DNS can support many technical workflows.
Domain Troubleshooting
Check whether a domain resolves correctly.
Mail Delivery Debugging
Review MX and SPF-related TXT records.
DNS Migration Validation
Confirm that records have changed after a provider or hosting migration.
Security Audit
Check SPF, DKIM, DMARC, NS, and exposed address records.
OSINT Enrichment
Collect DNS infrastructure indicators for a domain.
Incident Response
Review DNS changes, suspicious TXT records, or unexpected IP addresses.
Infrastructure Documentation
Create a quick snapshot of domain DNS configuration.
CDN and Hosting Review
Identify whether a domain points to CDN, cloud, or hosting infrastructure.
⚠️ Result Interpretation Notes
DNS results should be interpreted carefully.
Important points:
-
DNS records can change quickly.
-
Resolver cache may affect results.
-
GeoDNS may return different records from different regions.
-
CDN-backed domains may resolve to different IPs depending on location.
-
Missing records do not always mean misconfiguration.
-
TXT records can contain multiple unrelated service values.
-
MX records identify mail routing, not necessarily all email security settings.
-
TTL may be unavailable depending on backend response.
-
Some security records require querying specific subdomains, such as
_dmarc.example.com.
For critical DNS changes, compare results with authoritative DNS tools and multiple resolvers.
🛡️ Security, Privacy & Responsible Use
GlobeLine DNS is intended for lawful DNS troubleshooting, security analysis, domain administration, OSINT enrichment, and infrastructure review.
Acceptable use cases include:
-
Checking your own domains
-
Reviewing public DNS records
-
Validating mail configuration
-
Investigating suspicious domains
-
Supporting SOC triage
-
Documenting DNS infrastructure
-
Checking SPF, DKIM, DMARC, MX, and NS records
-
Monitoring domain changes
-
Troubleshooting DNS propagation
Users should follow responsible use principles:
-
Do not misuse DNS data for phishing or impersonation.
-
Do not use results to target third-party infrastructure.
-
Validate suspicious findings with additional sources.
-
Treat lookup history as potentially sensitive on shared devices.
-
Use the tool only for lawful and ethical analysis.
⚙️ Technical Highlights
-
DNS query tool
-
Available at
dash.niamonx.io/gl_dns -
Supports domain and subdomain input
-
Rejects protocols and URL paths
-
Supports A records
-
Supports AAAA records
-
Supports MX records
-
Supports NS records
-
Supports TXT records
-
Uses A automatically when no record type is selected
-
Supports multi-type queries
-
Shows requested record types
-
Shows resolved record types
-
Aggregates results by type
-
Shows record counts
-
Shows request time
-
Shows resolver information
-
Shows TTL when available
-
Stores domain history locally in the browser
-
Stores selected record types locally in the browser
-
Suitable for DNS troubleshooting, mail security checks, OSINT, SOC workflows, and infrastructure review
📌 Usage Hints
-
Enter only a domain or subdomain.
-
Do not include
https://, slashes, paths, or query strings. -
Select A for IPv4 address records.
-
Select AAAA for IPv6 address records.
-
Select MX to check mail servers.
-
Select NS to check authoritative name servers.
-
Select TXT to check SPF, verification, and other text records.
-
Use All for a complete basic DNS overview.
-
If nothing is selected, A will be used automatically.
-
Check requested and resolved types to understand missing results.
-
Remember that DNS responses may differ by resolver and region.
-
Query
_dmarc.example.comseparately to check DMARC. -
Query DKIM selector subdomains separately when needed.
-
Local history is stored in the browser.
📬 Contact Information
For technical, legal, abuse, privacy, or support-related inquiries, users can contact the NiamonX team directly:
support@niamonx.io — Technical Support
other@niamonx.io — General Inquiries
takedown@niamonx.io — Privacy or Data Removal Requests
legal@niamonx.io — Legal and Compliance Matters
Alternative contact channel:
🔗 Helpdesk: https://support.niamonx.io/
Summary
NiamonX GlobeLine DNS is a DNS query and domain record intelligence tool for checking A, AAAA, MX, NS, and TXT records.
It accepts clean domain or subdomain input, performs selected DNS queries, aggregates results by type, shows requested and resolved record groups, displays request time, resolver context, record counts, TTL values when available, and stores query history locally in the browser.
The tool is designed for DNS troubleshooting, mail configuration review, SPF and TXT analysis, infrastructure documentation, SOC triage, OSINT enrichment, and domain security workflows.
GeoDNS | Geographic DNS Response Intelligence
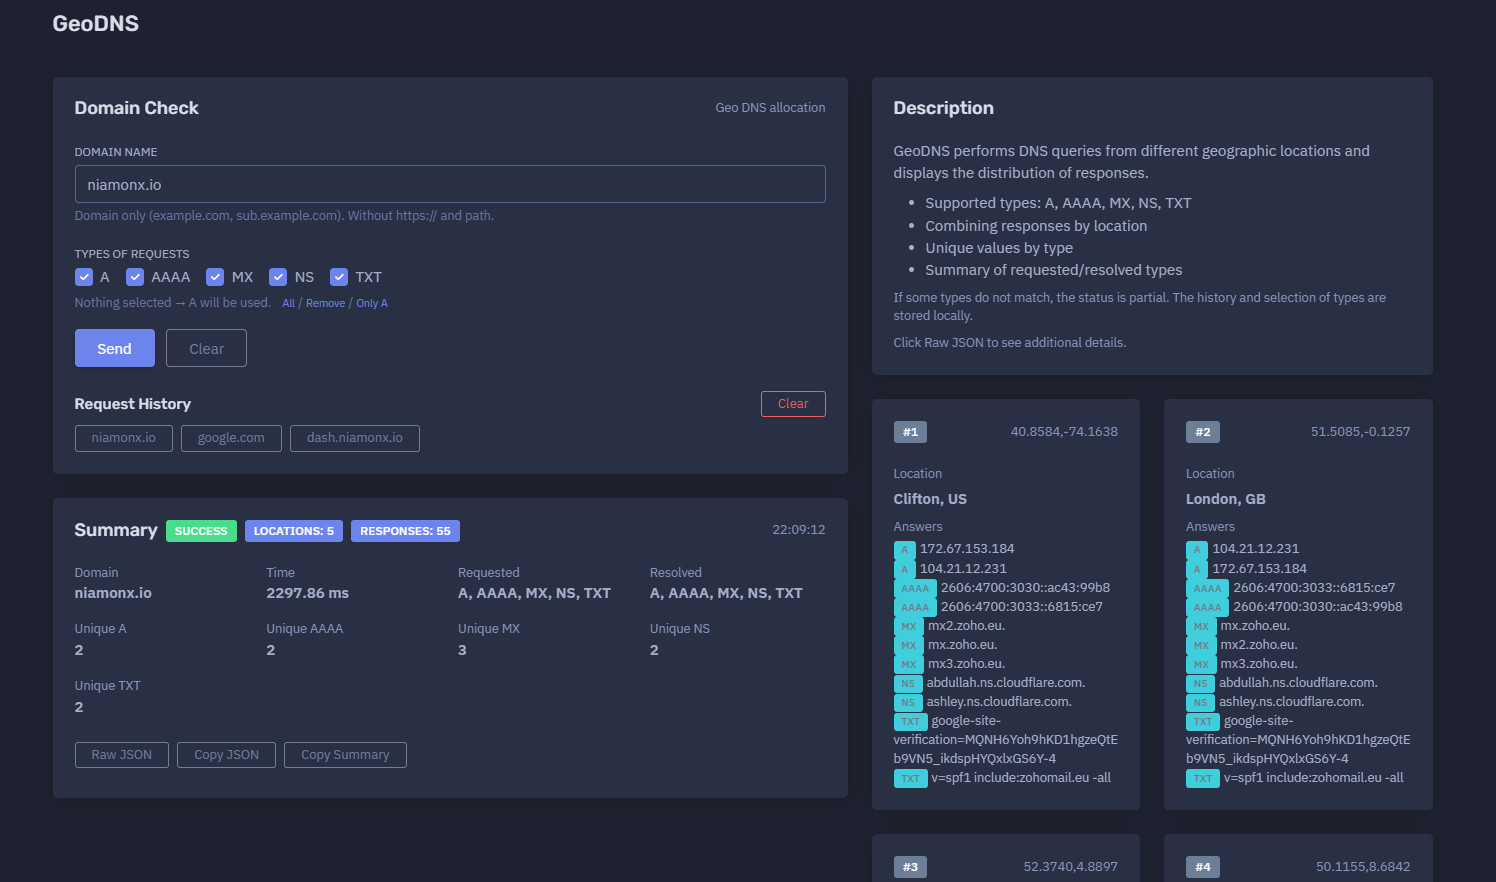
The platform available at https://dash.niamonx.io/geodns — known as GeoDNS — is a multi-location DNS intelligence tool within the NiamonX platform. It allows users to query DNS records for a domain from several geographic locations and compare how responses differ across regions.
Overview of the Service
GeoDNS is designed to help users understand how a domain resolves from different parts of the world.
Unlike a standard DNS lookup, which checks records from a single resolver or location, GeoDNS performs DNS queries from multiple geographic test points. This makes it possible to detect regional DNS differences, CDN routing behavior, GeoDNS configuration, DNS propagation issues, resolver inconsistencies, and location-based infrastructure allocation.
The tool supports common DNS record types, including:
-
A
-
AAAA
-
MX
-
NS
-
TXT
GeoDNS is useful for system administrators, DevOps teams, SOC analysts, cybersecurity researchers, infrastructure owners, domain administrators, compliance teams, and OSINT analysts who need to verify DNS behavior across multiple regions.
🔍 How the Tool Works
When a user enters a domain name and selects DNS record types, GeoDNS sends DNS queries from multiple geographic locations.
Each location performs the selected DNS requests and returns the records visible from that region. The tool then aggregates all responses and displays:
-
Global query status
-
Number of test locations
-
Total number of DNS responses
-
Total request time
-
Requested record types
-
Resolved record types
-
Unique values by record type
-
Per-location answers
-
Geographic source coordinates
-
Raw JSON with additional technical details
If no record type is selected, the tool automatically uses A records.
Example flow:
-
User enters a domain.
-
User selects one or more DNS record types.
-
GeoDNS queries the domain from several locations.
-
Responses are grouped by geographic source.
-
Unique DNS values are counted by type.
-
The final report shows global and regional DNS behavior.
🧩 What Can Be Checked
GeoDNS accepts clean domain and subdomain names only.
Valid examples:
example.com
sub.example.com
niamonx.io
Invalid examples:
https://example.com
example.com/path
https://example.com/login
1.1.1.1
The tool is intended for DNS checks of domains and subdomains. It should not be used with URLs, protocols, paths, query strings, IP addresses, or ports.
⚙️ Query Interface
The GeoDNS interface contains a domain input field and DNS record type controls.
Domain Name
The user enters a clean domain or subdomain.
Example:
niamonx.io
The interface expects the domain only, without:
-
https:// -
http:// -
Slashes
-
Paths
-
URL parameters
-
Ports
Types of Requests
Users can select one or more DNS record types.
Supported types:
-
A
-
AAAA
-
MX
-
NS
-
TXT
Quick controls may include:
-
All
-
Remove
-
Only A
If nothing is selected, the system automatically uses type A.
📌 Supported DNS Record Types
A Records
An A record maps a domain to an IPv4 address.
Example:
A 172.67.153.184
A records are commonly used for websites, APIs, CDNs, proxies, and IPv4 infrastructure.
AAAA Records
An AAAA record maps a domain to an IPv6 address.
Example:
AAAA 2606:4700:3033::6815:ce7
AAAA records are used for IPv6-enabled services.
MX Records
An MX record identifies mail servers responsible for receiving email for the domain.
Example:
MX mx.zoho.eu.
MX records are important for mail routing, email delivery, and mail-provider verification.
NS Records
An NS record identifies authoritative name servers for the domain.
Example:
NS abdullah.ns.cloudflare.com.
NS records show which DNS provider or authoritative DNS infrastructure controls the zone.
TXT Records
A TXT record stores text-based DNS data.
Common TXT record uses include:
-
SPF
-
DKIM
-
DMARC
-
Domain ownership verification
-
Google / Microsoft / SaaS verification
-
Security policies
-
Service configuration
Example:
TXT v=spf1 include:zohomail.eu -all
TXT records are often important for domain security and compliance checks.
📊 Summary Section
After a successful query, GeoDNS displays a global summary.
Typical fields include:
| Field | Description |
|---|---|
| Status | Overall query result status |
| Locations | Number of geographic locations used |
| Responses | Total number of returned DNS answers |
| Domain | Queried domain |
| Time | Total request duration |
| Requested | Record types requested by the user |
| Resolved | Record types successfully returned |
| Unique A | Number of unique IPv4 answers |
| Unique AAAA | Number of unique IPv6 answers |
| Unique MX | Number of unique mail server answers |
| Unique NS | Number of unique name server answers |
| Unique TXT | Number of unique TXT answers |
Example summary:
SUCCESS
Locations: 5
Responses: 55
Domain: niamonx.io
Time: 2297.86 ms
Requested: A, AAAA, MX, NS, TXT
Resolved: A, AAAA, MX, NS, TXT
Unique A: 2
Unique AAAA: 2
Unique MX: 3
Unique NS: 2
Unique TXT: 2
This summary helps users quickly understand whether DNS records are consistent globally and how many unique values were observed.
🌍 Per-Location Results
GeoDNS displays DNS answers separately for each test location.
Each location block may include:
-
Location number
-
Coordinates
-
City and country
-
Returned DNS answers
-
Record types returned from that location
Example location block:
#1
Location: Clifton, US
Coordinates: 40.8584, -74.1638
Answers:
A 172.67.153.184
A 104.21.12.231
AAAA 2606:4700:3030::ac43:99b8
MX mx.zoho.eu.
NS abdullah.ns.cloudflare.com.
TXT v=spf1 include:zohomail.eu -all
Per-location results are the core value of GeoDNS. They allow analysts to compare regional DNS behavior instead of relying on a single resolver response.
🗺️ Geographic Test Locations
GeoDNS uses multiple geographic sources for DNS resolution.
Example locations may include:
-
Clifton, US
-
London, GB
-
Amsterdam, NL
-
Frankfurt am Main, DE
-
Singapore, SG
Each location can return the same or different DNS answers depending on the domain’s DNS configuration, CDN provider, resolver behavior, cache state, or regional routing policy.
Geographic DNS results are especially useful for domains using:
-
CDN providers
-
Anycast DNS
-
GeoDNS
-
Regional load balancing
-
Multi-region infrastructure
-
Split traffic routing
-
Regional failover
-
DNS-based traffic steering
🔁 Requested vs Resolved Types
GeoDNS clearly shows which record types were requested and which were actually resolved.
Example:
Requested: A, AAAA, MX, NS, TXT
Resolved: A, AAAA, MX, NS, TXT
If some requested types do not return answers, the status may be partial.
Example:
Requested: A, AAAA, MX, NS, TXT
Resolved: A, NS, TXT
Status: partial
This helps analysts quickly identify missing or unavailable DNS records.
⚠️ Partial Status
If some selected record types do not match or do not return from all locations, the query may be marked as partial.
A partial result may indicate:
-
The domain does not have that record type.
-
Some resolvers did not return the record.
-
DNS propagation is incomplete.
-
A regional resolver returned different results.
-
A record type is blocked or filtered.
-
The backend source returned incomplete data.
-
The domain configuration is inconsistent.
A partial status is not always an error. It means the user should review the per-location answers and resolved types carefully.
🧮 Unique Values by Type
GeoDNS calculates unique DNS answers by record type.
Example:
Unique A: 2
Unique AAAA: 2
Unique MX: 3
Unique NS: 2
Unique TXT: 2
This is useful for identifying whether all locations returned the same values or whether responses vary geographically.
Low Unique Count
A low unique count usually means the DNS response is consistent globally.
High Unique Count
A high unique count may indicate:
-
GeoDNS routing
-
CDN edge allocation
-
Regional load balancing
-
DNS failover
-
Multi-cloud infrastructure
-
Inconsistent DNS propagation
-
Resolver differences
🌐 GeoDNS and CDN Behavior
Many modern domains use CDNs or geographically distributed DNS infrastructure. GeoDNS helps detect this behavior.
Possible patterns:
Same Records Everywhere
If all locations return the same A and AAAA values, the domain likely has globally consistent DNS responses.
Different A / AAAA Records by Region
If locations return different IPs, the domain may use GeoDNS, CDN edge routing, regional load balancing, or DNS steering.
Same MX / NS Everywhere
TXT Differences
TXT records are usually consistent, but differences may indicate propagation delay, configuration drift, or resolver cache differences.
📬 Mail and Security Record Review
GeoDNS can be used to check whether mail and security-related DNS records are globally visible.
Important record types:
-
MX
-
TXT
-
NS
Common TXT checks:
-
SPF
-
DKIM
-
DMARC
-
Domain verification
-
SaaS verification
Example SPF record:
v=spf1 include:zohomail.eu -all
To check DMARC, users should query:
_dmarc.example.com
To check DKIM, users should query the specific selector subdomain, such as:
selector._domainkey.example.com
📦 Raw JSON
The tool can show Raw JSON with additional technical details.
Raw JSON may include:
-
Location metadata
-
Resolver details
-
Record values
-
Record types
-
Response timing
-
Internal status fields
-
Backend diagnostics
-
Full per-location response objects
Raw JSON is useful for:
-
Advanced troubleshooting
-
Developer analysis
-
SOC workflows
-
API-style evidence capture
-
Comparing normalized and raw results
-
Creating internal reports
-
Debugging inconsistent DNS behavior
Raw output should be handled carefully when it contains internal investigation details.
🕓 Request History
GeoDNS stores domain query history and selected record types locally in the browser.
The history may include:
-
Queried domain
-
Selected record types
-
Timestamp
-
Status
-
Response count
-
Location count
Local history helps users repeat previous checks quickly.
Because it is browser-local, it may be cleared when browser data is deleted or when another browser profile is used.
🧠 Key Features
Multi-Location DNS Queries
Runs DNS checks from several geographic locations.
Domain and Subdomain Support
Accepts clean domain and subdomain names.
Common DNS Record Types
Supports A, AAAA, MX, NS, and TXT.
Automatic A Fallback
If no type is selected, A is used automatically.
Regional Response Comparison
Displays DNS answers separately by location.
Unique Value Aggregation
Counts unique DNS responses per record type.
Requested and Resolved Summary
Shows what was requested and what was returned.
Partial Status Detection
Highlights cases where not all requested types were resolved.
Raw JSON View
Allows technical review of additional response details.
Local History
Stores query history and selected types locally in the browser.
✅ Recommended Analyst Workflow
A practical GeoDNS workflow should follow these steps.
1. Enter a Clean Domain
Use only a domain or subdomain. Do not include protocol, path, or URL parameters.
2. Select Record Types
Choose A, AAAA, MX, NS, TXT, or use All for a broad overview.
3. Review the Summary
Check status, locations, responses, requested types, resolved types, and unique counts.
4. Compare Locations
Look for differences between Clifton, London, Amsterdam, Frankfurt, Singapore, or other returned locations.
5. Review Unique Values
Check whether unique A / AAAA values differ across regions.
6. Validate Mail Records
Review MX and TXT records for mail and verification consistency.
7. Investigate Partial Results
If status is partial, check which locations or record types did not return expected results.
8. Use Raw JSON When Needed
Open Raw JSON for deeper diagnostics.
9. Repeat After DNS Changes
Run another check after DNS updates, migrations, or propagation windows.
10. Confirm Critical Issues
🔎 Common Use Cases
GeoDNS supports many technical workflows.
DNS Propagation Check
Verify whether DNS updates are visible from multiple locations.
CDN Validation
Check whether a CDN returns different IPs by region.
GeoDNS Testing
Confirm location-based DNS allocation.
Mail Configuration Review
Check MX and TXT record consistency globally.
Domain Migration Validation
Verify that records changed correctly after moving DNS providers or hosting.
Incident Response
Investigate DNS hijacking, unexpected records, or inconsistent resolver behavior.
SOC and OSINT Enrichment
Collect regional DNS evidence for suspicious domains.
Infrastructure Monitoring
Track whether critical DNS records remain stable across locations.
⚠️ Result Interpretation Notes
GeoDNS results should be interpreted carefully.
Important points:
-
DNS responses may vary by location.
-
Different answers are not always suspicious.
-
CDN and GeoDNS providers intentionally return regional answers.
-
Resolver cache may affect results.
-
DNS propagation can take time.
-
TXT record order may vary between responses.
-
MX record order may vary while representing the same configuration.
-
Partial status may mean records are missing, filtered, delayed, or simply not configured.
-
One test is a snapshot, not continuous monitoring.
For production DNS decisions, compare GeoDNS results with authoritative DNS checks and monitoring tools.
🛡️ Security, Privacy & Responsible Use
GeoDNS is intended for lawful DNS troubleshooting, infrastructure analysis, security review, OSINT enrichment, and domain administration.
Acceptable use cases include:
-
Checking your own domains
-
Validating DNS propagation
-
Reviewing CDN behavior
-
Investigating suspicious domains
-
Checking mail configuration
-
Reviewing SPF, DKIM, DMARC, MX, and NS visibility
-
Supporting SOC triage
-
Documenting DNS infrastructure
-
Monitoring regional DNS behavior
Users should follow responsible use principles:
-
Do not use DNS intelligence for phishing or impersonation.
-
Do not target third-party infrastructure based only on DNS results.
-
Validate suspicious findings with additional sources.
-
Treat lookup history as potentially sensitive on shared devices.
-
Use Raw JSON responsibly.
-
Use the tool only for lawful and ethical analysis.
⚙️ Technical Highlights
-
GeoDNS intelligence module
-
Available at
dash.niamonx.io/geodns -
Performs DNS queries from multiple geographic locations
-
Supports domain and subdomain input
-
Rejects protocols, paths, and full URLs
-
Supports A records
-
Supports AAAA records
-
Supports MX records
-
Supports NS records
-
Supports TXT records
-
Uses A automatically when no type is selected
-
Shows global query status
-
Shows number of locations
-
Shows total response count
-
Shows total request time
-
Shows requested record types
-
Shows resolved record types
-
Counts unique records by type
-
Displays answers per location
-
Shows location coordinates
-
Supports Raw JSON details
-
Stores query history locally
-
Stores selected record types locally
-
Suitable for DNS propagation checks, CDN validation, SOC workflows, OSINT, and infrastructure monitoring
📌 Usage Hints
-
Enter only a domain or subdomain.
-
Do not include
https://, paths, query strings, or slashes. -
Select A for IPv4 address records.
-
Select AAAA for IPv6 address records.
-
Select MX for mail routing.
-
Select NS for authoritative name servers.
-
Select TXT for SPF, verification, and security records.
-
Use All for a complete basic DNS overview.
-
If nothing is selected, A will be used automatically.
-
Compare answers by location to detect GeoDNS behavior.
-
Check unique values to understand regional differences.
-
Use Raw JSON for deeper diagnostics.
-
Query
_dmarc.example.comseparately for DMARC. -
Query DKIM selector subdomains separately for DKIM.
-
Remember that DNS results can differ because of cache, CDN, resolver, or propagation behavior.
📬 Contact Information
For technical, legal, abuse, privacy, or support-related inquiries, users can contact the NiamonX team directly:
support@niamonx.io — Technical Support
other@niamonx.io — General Inquiries
takedown@niamonx.io — Privacy or Data Removal Requests
legal@niamonx.io — Legal and Compliance Matters
Alternative contact channel:
🔗 Helpdesk: https://support.niamonx.io/
Summary
NiamonX GeoDNS is a multi-location DNS intelligence tool that checks DNS records from several geographic locations and shows how domain responses are distributed globally.
It supports A, AAAA, MX, NS, and TXT queries, displays requested and resolved record types, counts unique values by type, groups answers by location, provides Raw JSON for deeper analysis, and stores query history locally in the browser.
The tool is designed for DNS propagation checks, GeoDNS validation, CDN behavior analysis, mail configuration review, SOC triage, OSINT enrichment, domain migration validation, and infrastructure monitoring.
DNS Resolver / Reverse | Forward and Reverse DNS Resolution
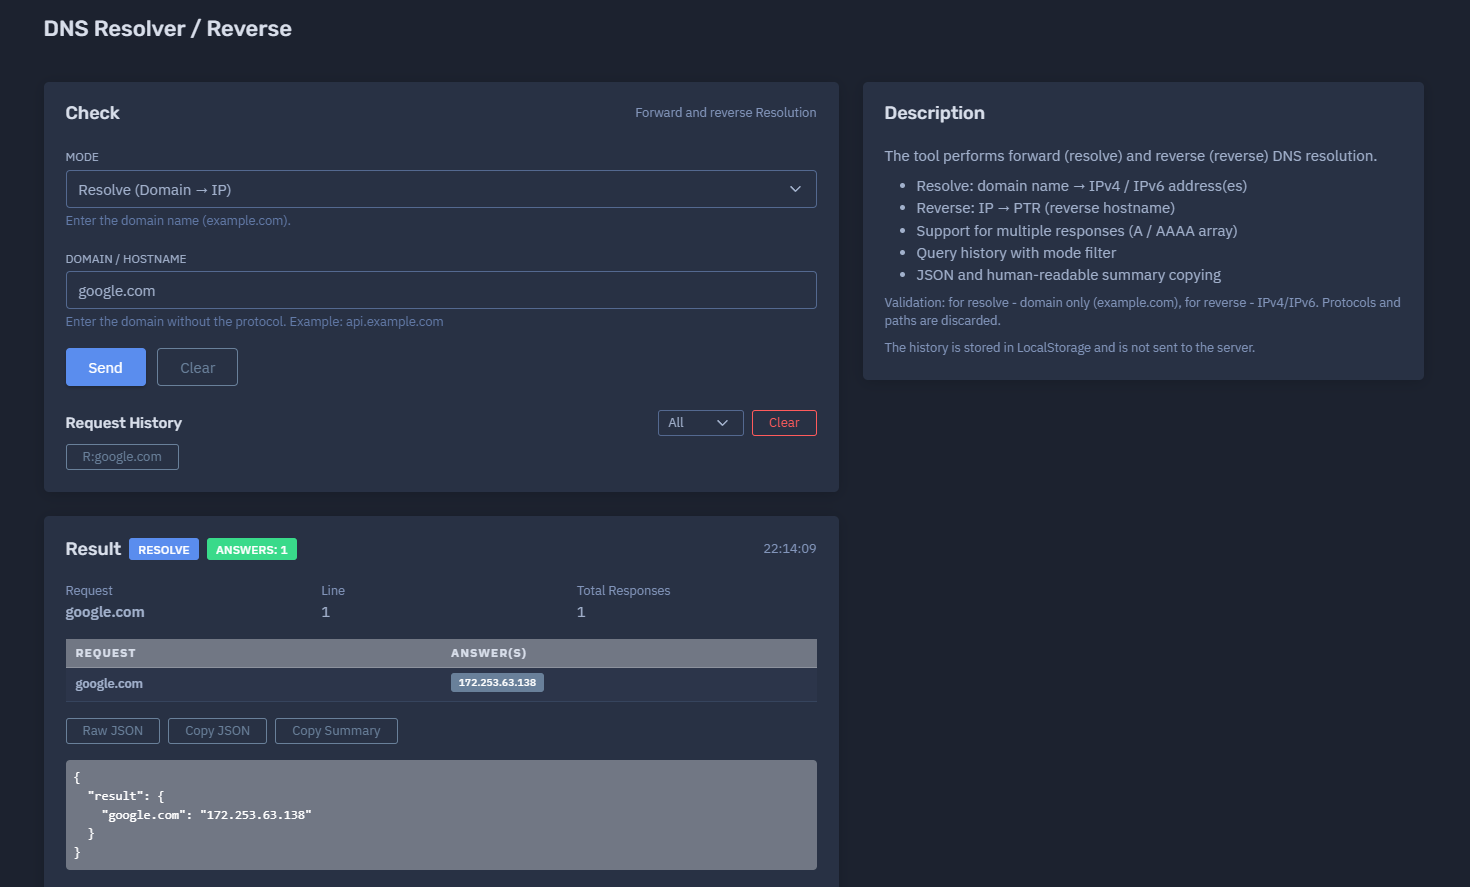
The platform available at https://dash.niamonx.io/dns_rrsv — known as DNS Resolver / Reverse — is a DNS resolution utility within the NiamonX platform. It allows users to perform forward DNS resolution from a domain name to IP address and reverse DNS resolution from an IP address to PTR hostname.
Overview of the Service
DNS Resolver / Reverse is designed for fast, simple, and structured DNS resolution checks.
The tool supports two core workflows:
-
Resolve — domain name to IPv4 / IPv6 address
-
Reverse — IP address to PTR / reverse hostname
It is useful for system administrators, SOC analysts, cybersecurity researchers, developers, DevOps engineers, infrastructure owners, incident responders, and OSINT analysts who need to quickly verify how a domain resolves or which reverse DNS name is associated with an IP address.
The tool provides both a human-readable result table and a JSON output, making it suitable for manual analysis, documentation, troubleshooting, and lightweight technical workflows.
🔍 How the Tool Works
The user selects a mode and enters the appropriate value.
In Resolve mode, the user enters a domain or hostname. The tool returns one or more IPv4 / IPv6 addresses associated with that name.
Example:
google.com → 172.253.63.138
In Reverse mode, the user enters an IPv4 or IPv6 address. The tool performs a reverse DNS lookup and returns the PTR hostname when available.
Example:
8.8.8.8 → dns.google
The output is displayed in a compact result block, a request / answer table, and raw JSON format.
The history of lookups is stored locally in the browser through LocalStorage and is not sent to the server.
🧩 Supported Modes
DNS Resolver / Reverse supports two main modes.
Resolve Mode
Resolve mode performs forward DNS resolution.
Direction:
Domain → IP
This mode accepts a clean domain or hostname.
Examples:
example.com
api.example.com
google.com
Resolve mode may return:
-
One IPv4 address
-
Multiple IPv4 addresses
-
One IPv6 address
-
Multiple IPv6 addresses
-
Mixed A / AAAA-style responses, depending on backend resolution behavior
Reverse Mode
Reverse mode performs reverse DNS resolution.
Direction:
IP → PTR
This mode accepts IPv4 or IPv6 addresses.
Examples:
8.8.8.8
1.1.1.1
2606:4700:4700::1111
Reverse mode may return a PTR hostname if one exists.
Not every IP address has reverse DNS configured. If no PTR record exists, the tool may return an empty result, error state, or no answer depending on backend behavior.
🚫 Input Rules
The tool validates input depending on the selected mode.
Resolve Mode Input
Allowed:
-
Domain names
-
Subdomains
-
Hostnames
Examples:
example.com
api.example.com
Not allowed:
https://example.com
example.com/path
example.com:443
http://api.example.com/v1
Protocols and paths are discarded or rejected depending on validation behavior. For best results, users should enter only the clean domain or hostname.
Reverse Mode Input
Allowed:
-
IPv4 addresses
-
IPv6 addresses
Examples:
1.1.1.1
2001:4860:4860::8888
Not allowed:
example.com
https://1.1.1.1
1.1.1.1:443
Reverse mode expects only a clean IP address.
⚙️ Interface Structure
The DNS Resolver / Reverse interface contains the following main elements.
Mode
The user selects the lookup mode.
Available modes:
-
Resolve
-
Reverse
Example:
Mode: Resolve (Domain → IP)
Domain / Hostname
In Resolve mode, the user enters a domain or hostname.
Example:
google.com
IP Address
In Reverse mode, the user enters an IPv4 or IPv6 address.
Example:
8.8.8.8
Request History
The interface includes local request history with mode filtering.
Users can filter history by:
-
All
-
Resolve
-
Reverse
This helps quickly review previous DNS checks.
📊 Result Summary
After a lookup is completed, the tool displays a result summary.
Example:
RESOLVE
Answers: 1
Request: google.com
Line: 1
Total Responses: 1
The summary helps users quickly understand:
-
Which mode was used
-
Whether the lookup returned answers
-
How many responses were returned
-
What value was requested
📋 Request / Answer Table
The result table displays the original request and the returned answer or answers.
Example:
| Request | Answer(s) |
|---|---|
google.com |
172.253.63.138 |
For domains with multiple results, the answer field may contain several IP addresses.
Example:
| Request | Answer(s) |
|---|---|
example.com |
93.184.216.34, 2606:2800:220:1:248:1893:25c8:1946 |
For reverse lookups, the table may show:
| Request | Answer(s) |
|---|---|
8.8.8.8 |
dns.google |
This format is designed for quick copying into tickets, reports, notes, or troubleshooting documentation.
🧾 JSON Output
The tool also provides a raw JSON-style result.
Example:
{
  "result": {
    "google.com": "172.253.63.138"
  }
}
JSON output is useful for:
-
Technical documentation
-
Automation workflows
-
Internal tools
-
Evidence capture
-
Debugging
-
SOC case notes
-
Copying structured results into reports
When multiple answers are returned, the JSON may include arrays or multiple values depending on backend output.
🔁 Forward Resolution
Forward DNS resolution maps a domain name to one or more IP addresses.
Common use cases:
-
Checking where a domain points
-
Validating DNS configuration
-
Troubleshooting domain access
-
Confirming CDN or hosting resolution
-
Checking if a hostname resolves
-
Reviewing infrastructure during migration
-
Enriching indicators during SOC triage
Example:
api.example.com → 203.0.113.10
Forward resolution may return IPv4, IPv6, or both depending on the records available.
🔄 Reverse Resolution
Reverse DNS resolution maps an IP address to a hostname using PTR records.
Common use cases:
-
Identifying server naming
-
Reviewing mail server configuration
-
Investigating suspicious IPs
-
Enriching security logs
-
Checking hosting infrastructure
-
Validating reverse DNS for outbound mail systems
-
Mapping infrastructure ownership clues
Example:
1.1.1.1 → one.one.one.one
Reverse DNS is optional. Many IP addresses do not have PTR records, and some PTR records may be generic or outdated.
🧠 Key Features
Forward DNS Resolution
Resolves a domain or hostname to IP address data.
Reverse DNS Resolution
Resolves an IP address to PTR hostname when available.
IPv4 and IPv6 Support
Reverse mode supports both IPv4 and IPv6.
Multiple Responses
The tool supports multiple returned responses, including A / AAAA-style arrays.
Human-Readable Summary
Results are displayed in a clean request / answer format.
JSON Output
Structured JSON output is available for technical workflows.
Mode-Based History
Query history can be filtered by lookup mode.
LocalStorage Privacy
History is stored locally in the browser and is not sent to the server.
Input Validation
Resolve mode validates domain input, while reverse mode validates IPv4 / IPv6 input.
🕓 Request History
The request history stores previous lookups locally in the browser.
Important behavior:
The history is stored in LocalStorage and is not sent to the server.
History may include:
-
Lookup mode
-
Requested value
-
Result summary
-
Timestamp
-
Number of answers
History is useful for repeating checks and reviewing recent troubleshooting activity.
Because it is browser-local, it may be cleared if the user clears browser data, switches devices, or uses a different browser profile.
🔎 Common Use Cases
DNS Resolver / Reverse can support many technical workflows.
Domain Troubleshooting
Check whether a domain or subdomain resolves to an IP address.
Reverse DNS Verification
Check whether an IP address has a PTR hostname.
Mail Server Review
Verify reverse DNS for mail infrastructure.
SOC Triage
Enrich suspicious domains or IPs during alert analysis.
Incident Response
Quickly map domains to IPs or IPs to hostnames.
Infrastructure Migration
Validate whether DNS changes resolve as expected.
OSINT Enrichment
Collect basic resolution data for public indicators.
Developer Debugging
Confirm whether an application hostname resolves correctly.
📬 Mail and Reverse DNS
Reverse DNS is especially important for email infrastructure.
Mail servers often require properly configured PTR records to improve deliverability and reduce spam classification risk.
Example checks:
mail.example.com → 203.0.113.25
203.0.113.25 → mail.example.com
A clean forward-confirmed reverse DNS setup can help validate that the hostname and IP align.
However, this tool performs direct resolve and reverse checks only. Full mail authentication review should also include MX, SPF, DKIM, DMARC, and SMTP banner validation.
⚠️ Result Interpretation Notes
DNS resolution results should be interpreted carefully.
Important points:
-
DNS answers may change over time.
-
CDN-backed domains may return different IPs from different resolvers.
-
Some domains return multiple A or AAAA records.
-
Reverse DNS may not exist for every IP.
-
PTR records can be outdated or generic.
-
A resolved IP does not prove exclusive ownership.
-
A reverse hostname does not always identify the real service.
-
DNS caching can affect repeated results.
-
Forward and reverse DNS may not match perfectly.
-
A single lookup is a snapshot, not continuous monitoring.
For critical infrastructure decisions, users should compare results with authoritative DNS data and multiple resolvers.
✅ Recommended Workflow
A practical DNS resolution workflow should follow these steps.
1. Choose the Correct Mode
Use Resolve for domain-to-IP checks and Reverse for IP-to-hostname checks.
2. Enter a Clean Value
Use only a domain in Resolve mode or only an IP in Reverse mode.
3. Review the Summary
Check mode, answer count, request value, and total responses.
4. Review the Table
Copy the request / answer pair if needed.
5. Check JSON Output
Use JSON for structured documentation or technical workflows.
6. Compare With Other DNS Tools
For critical results, verify using authoritative DNS or multi-location DNS tools.
7. Review Local History
Use the mode filter to find previous checks.
8. Clear History on Shared Devices
Remove LocalStorage history if the lookup values are sensitive.
🛡️ Security, Privacy & Responsible Use
DNS Resolver / Reverse is intended for lawful DNS troubleshooting, system administration, cybersecurity analysis, OSINT enrichment, and infrastructure review.
Acceptable use cases include:
-
Checking your own domains
-
Resolving public hostnames
-
Reviewing PTR records
-
Investigating suspicious IPs
-
Supporting SOC workflows
-
Debugging network applications
-
Validating infrastructure changes
-
Creating technical documentation
Users should follow responsible use principles:
-
Do not use DNS data for phishing, impersonation, or targeting.
-
Do not assume ownership from a single DNS answer.
-
Do not treat missing reverse DNS as proof of malicious activity.
-
Validate important conclusions with additional sources.
-
Treat local lookup history as potentially sensitive on shared devices.
-
Use the tool only for lawful and ethical analysis.
⚙️ Technical Highlights
-
Forward and reverse DNS resolution tool
-
Available at
dash.niamonx.io/dns_rrsv -
Resolve mode: domain name to IPv4 / IPv6 address
-
Reverse mode: IP address to PTR hostname
-
Supports multiple responses
-
Supports A / AAAA-style arrays
-
Human-readable result table
-
JSON result output
-
Summary copying support
-
JSON copying support
-
Query history with mode filter
-
Resolve validation: domain only
-
Reverse validation: IPv4 / IPv6 only
-
Protocols and paths are discarded or rejected
-
History stored locally in browser LocalStorage
-
History is not sent to the server
-
Suitable for DNS troubleshooting, SOC triage, OSINT enrichment, infrastructure review, and DevOps workflows
📌 Usage Hints
-
Use Resolve mode for domain-to-IP checks.
-
Use Reverse mode for IP-to-PTR checks.
-
Enter domains without
https://, paths, or slashes. -
Enter only IPv4 or IPv6 in Reverse mode.
-
Review multiple answers when returned.
-
Use JSON output for technical documentation.
-
Use request history mode filters to find previous checks.
-
Remember that reverse DNS is optional and may be missing.
-
DNS answers may differ by resolver, geography, and cache.
-
Use GeoDNS for multi-location DNS comparison.
-
Use GlobeLine DNS for record-type-specific DNS checks.
-
Clear local history on shared devices.
📬 Contact Information
For technical, legal, abuse, privacy, or support-related inquiries, users can contact the NiamonX team directly:
support@niamonx.io — Technical Support
other@niamonx.io — General Inquiries
takedown@niamonx.io — Privacy or Data Removal Requests
legal@niamonx.io — Legal and Compliance Matters
Alternative contact channel:
🔗 Helpdesk: https://support.niamonx.io/
Summary
NiamonX DNS Resolver / Reverse is a lightweight DNS utility for forward and reverse resolution. It resolves domains and hostnames to IPv4 / IPv6 addresses, resolves IP addresses to PTR hostnames, supports multiple responses, displays results in both human-readable and JSON formats, and stores lookup history locally in the browser.
The tool is designed for DNS troubleshooting, infrastructure validation, SOC triage, OSINT enrichment, mail server review, DevOps workflows, and technical documentation.
Reverse IP Lookup | Passive Reverse IP Domain Intelligence
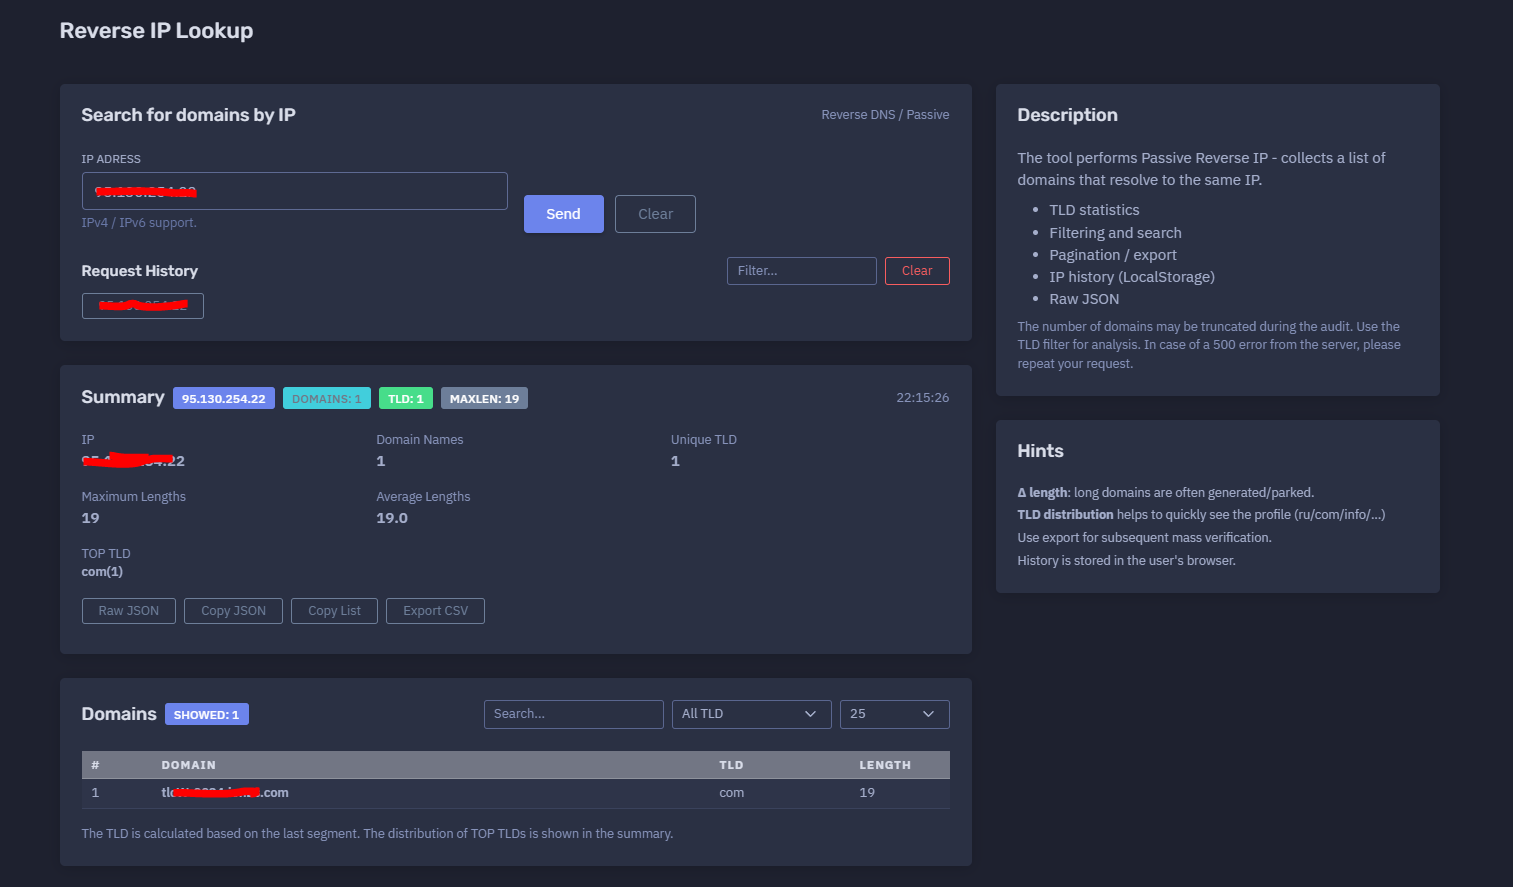
The platform available at https://dash.niamonx.io/ripip — known as Reverse IP Lookup — is a passive reverse IP intelligence tool within the NiamonX platform. It allows users to search for domain names associated with a specific IPv4 or IPv6 address using passive DNS and reverse DNS-style intelligence sources.
Overview of the Service
Reverse IP Lookup is designed to help analysts identify which domains have been observed resolving to the same IP address.
The tool is useful for cybersecurity analysts, SOC teams, OSINT researchers, infrastructure owners, incident responders, fraud investigators, domain researchers, and compliance teams who need to understand the domain footprint connected to a specific IP.
A single IP address can host one domain, many unrelated domains, parked domains, generated domains, CDN-backed assets, customer websites, phishing infrastructure, malware infrastructure, or shared hosting environments. Reverse IP Lookup helps expose these relationships in a clean and structured format.
The tool performs Passive Reverse IP analysis, meaning it collects known or observed domain associations for the IP rather than actively scanning the server.
🔍 How the Tool Works
When a user enters an IP address, Reverse IP Lookup searches passive DNS / reverse intelligence data for domains that have been observed resolving to that IP.
The result contains a summary and a domain table.
The system may return:
-
Total number of domains
-
Number of unique TLDs
-
Maximum domain length
-
Average domain length
-
Top TLD distribution
-
Domain list
-
TLD filter
-
Search filter
-
Pagination
-
Export options
-
Raw JSON
-
Local browser request history
Example input:
95.130.254.22
Example result summary:
IP: 95.130.254.22
Domains: 1
Unique TLD: 1
MaxLen: 19
Average Length: 19.0
Top TLD: com(1)
This gives users a quick view of how many domains are connected to the IP and what kind of domain distribution was observed.
🧩 What Can Be Searched
Reverse IP Lookup supports IP-based lookup.
Supported input types:
-
IPv4 address
-
IPv6 address
Valid examples:
95.130.254.22
1.1.1.1
2001:4860:4860::8888
Unsupported input examples:
example.com
https://example.com
95.130.254.22:443
example.com/path
The tool expects only a clean IPv4 or IPv6 address. Domain-to-IP resolution should be performed in a separate DNS or IP / Domain Explorer module before using Reverse IP Lookup.
📌 What Passive Reverse IP Means
Passive Reverse IP means that the tool uses collected or observed DNS intelligence to identify domains linked to an IP address.
It is different from:
-
Active port scanning
-
Web crawling
-
Directory brute-forcing
-
Service exploitation
-
Live server enumeration
Passive Reverse IP focuses on known domain-to-IP associations.
This approach is useful because it allows analysts to understand the visible domain footprint of an IP without directly interacting with hosted websites or services.
⚙️ Interface Structure
The Reverse IP Lookup interface contains several key areas.
IP Address Input
The main field where the user enters an IPv4 or IPv6 address.
Example:
95.130.254.22
The interface supports IPv4 and IPv6.
Request History
Displays previous IP lookups stored locally in the browser.
Summary
Shows total domain statistics for the queried IP.
Domains Table
Displays the domain names associated with the IP.
TLD Filter
Allows users to filter domains by top-level domain.
Search Filter
Allows users to search within the returned domain list.
Raw JSON
Provides structured technical output for advanced analysis.
📊 Summary Section
The summary section provides a quick statistical overview of the IP’s domain footprint.
Typical fields include:
| Field | Description |
|---|---|
| IP | Queried IPv4 or IPv6 address |
| Domains | Total number of returned domain names |
| Domain Names | Count of domain records |
| Unique TLD | Number of unique top-level domains |
| Maximum Lengths | Longest domain length in the result set |
| Average Lengths | Average domain length |
| TOP TLD | Most frequent TLDs and their counts |
| Timestamp | Time when the lookup was performed |
Example:
IP: 95.130.254.22
Domain Names: 1
Unique TLD: 1
Maximum Lengths: 19
Average Lengths: 19.0
TOP TLD: com(1)
This helps users quickly determine whether the IP is associated with a small, focused set of domains or a large, diverse hosting footprint.
🌐 Domains Table
The Domains table displays the domains associated with the queried IP.
Typical columns include:
| Column | Description |
|---|---|
| # | Row number |
| Domain | Domain name observed on the IP |
| TLD | Top-level domain |
| Length | Domain length |
Example safe table format:
| # | Domain | TLD | Length |
|---|---|---|---|
| 1 | example-host.example.com | com | 24 |
The table is designed for filtering, review, pagination, and export.
🏷️ TLD Statistics
Reverse IP Lookup calculates TLD distribution from returned domains.
Example:
TOP TLD: com(1)
The TLD is calculated based on the last segment of the domain.
Examples:
| Domain | Calculated TLD |
|---|---|
example.com |
com |
test.org |
org |
site.co.uk |
uk |
portal.net |
net |
TLD distribution helps analysts quickly understand the profile of domains on an IP.
For example:
-
Many
.comdomains may indicate commercial hosting. -
Many country-code TLDs may indicate regional infrastructure.
-
Many unusual TLDs may require closer review.
-
Mixed TLDs may indicate shared hosting, parking, CDN usage, or multi-customer infrastructure.
📏 Domain Length Metrics
The tool calculates maximum and average domain length.
Fields:
-
Maximum Lengths
-
Average Lengths
Long domains may be useful signals during investigation.
Possible interpretations of unusually long domains:
-
Generated domains
-
Tracking domains
-
Parked domains
-
Temporary infrastructure
-
Phishing kits
-
Campaign-specific infrastructure
-
Randomized hostnames
-
Bulk-created domains
Important: long domain length alone does not prove malicious activity. It is a triage signal that should be reviewed with additional context.
🔎 Filtering and Search
The interface includes filtering tools to make large result sets easier to analyze.
Users can filter by:
-
Domain text
-
TLD
-
Visible table rows
-
Page size
Example use cases:
-
Show only
.comdomains -
Search for a brand name
-
Search for a specific keyword
-
Review only suspicious-looking domains
-
Separate regional TLDs
-
Find domains with shared naming patterns
Filtering is especially useful when an IP has many associated domains.
📄 Pagination
Reverse IP Lookup supports pagination for large result sets.
The user can control how many rows are shown per page.
Example:
25
Pagination helps keep the interface fast and readable when many domains are returned.
For very large responses, the number of domains may be truncated during the audit. Users should use TLD filtering and export options for deeper analysis.
📤 Export
The tool supports export for further analysis.
Export is useful for:
-
Bulk verification
-
Domain reputation checks
-
Threat intelligence enrichment
-
Spreadsheet analysis
-
SOC case documentation
-
Incident response reports
-
Passive DNS comparison
-
Brand abuse monitoring
-
Infrastructure mapping
Exported data may include:
-
Domain
-
TLD
-
Length
-
IP
-
Summary metadata
Exported results should be stored securely when they are used in investigations.
🧾 Raw JSON
Reverse IP Lookup can expose raw JSON output.
Raw JSON may include:
-
Queried IP
-
Domain list
-
TLD statistics
-
Counts
-
Length metrics
-
Backend metadata
-
Response status
-
Timestamp
Raw JSON is useful for:
-
Technical diagnostics
-
API-style workflows
-
Evidence preservation
-
SOC automation
-
Case management
-
Comparing normalized and raw output
-
Internal reporting
Raw JSON should be handled carefully when it contains sensitive investigation context.
🕓 Request History
The tool stores IP lookup history locally in the user’s browser.
Important behavior:
History is stored in the user's browser.
History may include:
-
Queried IP
-
Timestamp
-
Result count
-
Summary data
-
Search mode
Local history is useful for repeating checks and reviewing previous analysis.
Because it is stored locally, it may be cleared when the user deletes browser data, switches devices, or uses another browser profile.
🧠 Key Features
Passive Reverse IP Lookup
Finds domains observed resolving to the same IP address.
IPv4 and IPv6 Support
Supports both IPv4 and IPv6 inputs.
Domain List
Displays associated domains in a structured table.
TLD Statistics
Calculates unique TLD count and top TLD distribution.
Domain Length Metrics
Shows maximum and average domain length.
Filtering and Search
Allows filtering by domain text and TLD.
Pagination
Supports large result sets through paginated display.
Export
Allows results to be exported for further analysis.
Raw JSON
Provides structured technical output for advanced users.
Local History
Stores IP lookup history locally in the browser.
🔍 Common Use Cases
Reverse IP Lookup supports many cybersecurity and OSINT workflows.
Shared Hosting Analysis
Identify domains hosted on the same IP address.
Threat Intelligence
Incident Response
Check whether a malicious IP hosts other domains that may be part of the same campaign.
Brand Protection
Search for domains on suspicious hosting infrastructure that may imitate a brand.
Phishing Investigation
Identify clusters of domains hosted on the same IP.
Infrastructure Mapping
Understand which domains are connected to an owned or third-party IP.
Asset Discovery
Find forgotten or related domains pointing to company infrastructure.
Fraud Investigation
Identify domains linked to suspicious hosting or repeated abuse patterns.
Malware Infrastructure Review
Check whether C2, landing, or payload domains share the same IP.
Compliance and Audit
Document domain exposure associated with organizational IPs.
🧠 Result Interpretation
Reverse IP data should be interpreted carefully.
Important notes:
-
Domain associations may be historical.
-
A domain resolving to an IP does not prove ownership of that IP.
-
Shared hosting can contain many unrelated domains.
-
CDN and proxy infrastructure may show domains from many customers.
-
Passive DNS records may be outdated.
-
Some domains may no longer resolve to the IP.
-
A small result set does not mean the IP hosts only those domains.
-
A large result set does not automatically mean malicious activity.
-
TLD distribution is a profile signal, not a verdict.
-
Long domains are often worth reviewing but are not proof of abuse.
Reverse IP Lookup should be used as an intelligence enrichment tool and correlated with DNS, WHOIS, TLS, HTTP, crawler, and reputation data.
🚨 Server Errors and Truncated Data
The tool notes that the number of domains may be truncated during the audit.
This means returned results may represent only part of the full available dataset.
If a server error occurs, such as a 500 response, users should repeat the request.
Recommended handling:
-
Retry after a short delay.
-
Use TLD filters to reduce result size.
-
Export visible results for offline analysis.
-
Compare with other NiamonX tools.
-
Do not assume a failed response means no domains exist.
✅ Recommended Analyst Workflow
A practical reverse IP investigation should follow these steps.
1. Enter a Clean IP Address
Use only an IPv4 or IPv6 address.
2. Review the Summary
Check total domains, unique TLDs, maximum length, average length, and top TLDs.
3. Inspect the Domain Table
Review domain names and look for obvious patterns.
4. Use Search and TLD Filters
Filter by suspicious terms, brand names, TLDs, or naming structures.
5. Review Long Domains
Long or unusual domains may indicate generated, parked, or campaign-style infrastructure.
6. Export Results
Use export for bulk verification or deeper investigation.
7. Correlate With Other Tools
Check interesting domains with DNS, GeoDNS, WHOIS, TLS, IP intelligence, web fingerprinting, or reputation tools.
8. Validate Current Resolution
Confirm whether selected domains still resolve to the IP.
9. Preserve Evidence
Save relevant records and timestamps for reports or incident cases.
10. Avoid Overclaiming
Treat associations as leads until confirmed by additional evidence.
🛡️ Security, Privacy & Responsible Use
Reverse IP Lookup is intended for lawful cybersecurity, OSINT, infrastructure analysis, incident response, and defensive research.
Acceptable use cases include:
-
Checking your own IP infrastructure
-
Investigating suspicious IPs
-
Mapping domains on shared infrastructure
-
Enriching threat intelligence
-
Supporting SOC triage
-
Reviewing phishing or malware infrastructure
-
Discovering exposed company assets
-
Brand protection
-
Compliance documentation
-
Research and reporting
Users should follow responsible use rules:
-
Do not use results to attack hosted domains.
-
Do not harass domain owners or hosting providers.
-
Do not assume all domains on an IP are related.
-
Do not treat passive DNS as current truth without validation.
-
Do not use the tool for unauthorized access, abuse, phishing, or exploitation.
-
Validate findings before operational, legal, or public reporting.
-
Treat exported results as sensitive investigation data.
⚙️ Technical Highlights
-
Passive Reverse IP lookup tool
-
Available at
dash.niamonx.io/ripip -
Searches for domains associated with an IP address
-
Supports IPv4
-
Supports IPv6
-
Uses reverse DNS / passive intelligence sources
-
Summary with domain count
-
Unique TLD count
-
Top TLD distribution
-
Maximum domain length
-
Average domain length
-
Domain table
-
TLD filter
-
Text search
-
Pagination
-
Export support
-
Raw JSON support
-
LocalStorage IP history
-
Handles potentially truncated responses
-
Retry recommended on server-side 500 errors
-
Suitable for SOC, OSINT, threat intelligence, incident response, fraud analysis, and infrastructure mapping
📌 Usage Hints
-
Enter only an IPv4 or IPv6 address.
-
Use the TLD filter for large result sets.
-
Use search to find brand names, suspicious keywords, or patterns.
-
Long domains are often generated, parked, or campaign-related, but require validation.
-
TLD distribution helps quickly understand the domain profile.
-
Export results for later mass verification.
-
Validate whether domains currently resolve to the IP.
-
Use Raw JSON for technical workflows.
-
Retry the request if a server-side 500 error occurs.
-
Remember that passive data can be historical or incomplete.
-
History is stored locally in the browser.
📬 Contact Information
For technical, legal, abuse, privacy, or support-related inquiries, users can contact the NiamonX team directly:
support@niamonx.io — Technical Support
other@niamonx.io — General Inquiries
takedown@niamonx.io — Privacy or Data Removal Requests
legal@niamonx.io — Legal and Compliance Matters
Alternative contact channel:
🔗 Helpdesk: https://support.niamonx.io/
Summary
NiamonX Reverse IP Lookup is a passive reverse IP intelligence tool that identifies domains observed resolving to the same IPv4 or IPv6 address.
It provides domain counts, unique TLD statistics, top TLD distribution, domain length metrics, filtering, search, pagination, export, Raw JSON, and local browser history.
The tool is designed for lawful OSINT, SOC triage, threat intelligence enrichment, phishing investigation, malware infrastructure analysis, asset discovery, brand protection, and infrastructure mapping. Results should be treated as passive intelligence leads and validated before conclusions or action.
ASN Information | Autonomous System Intelligence
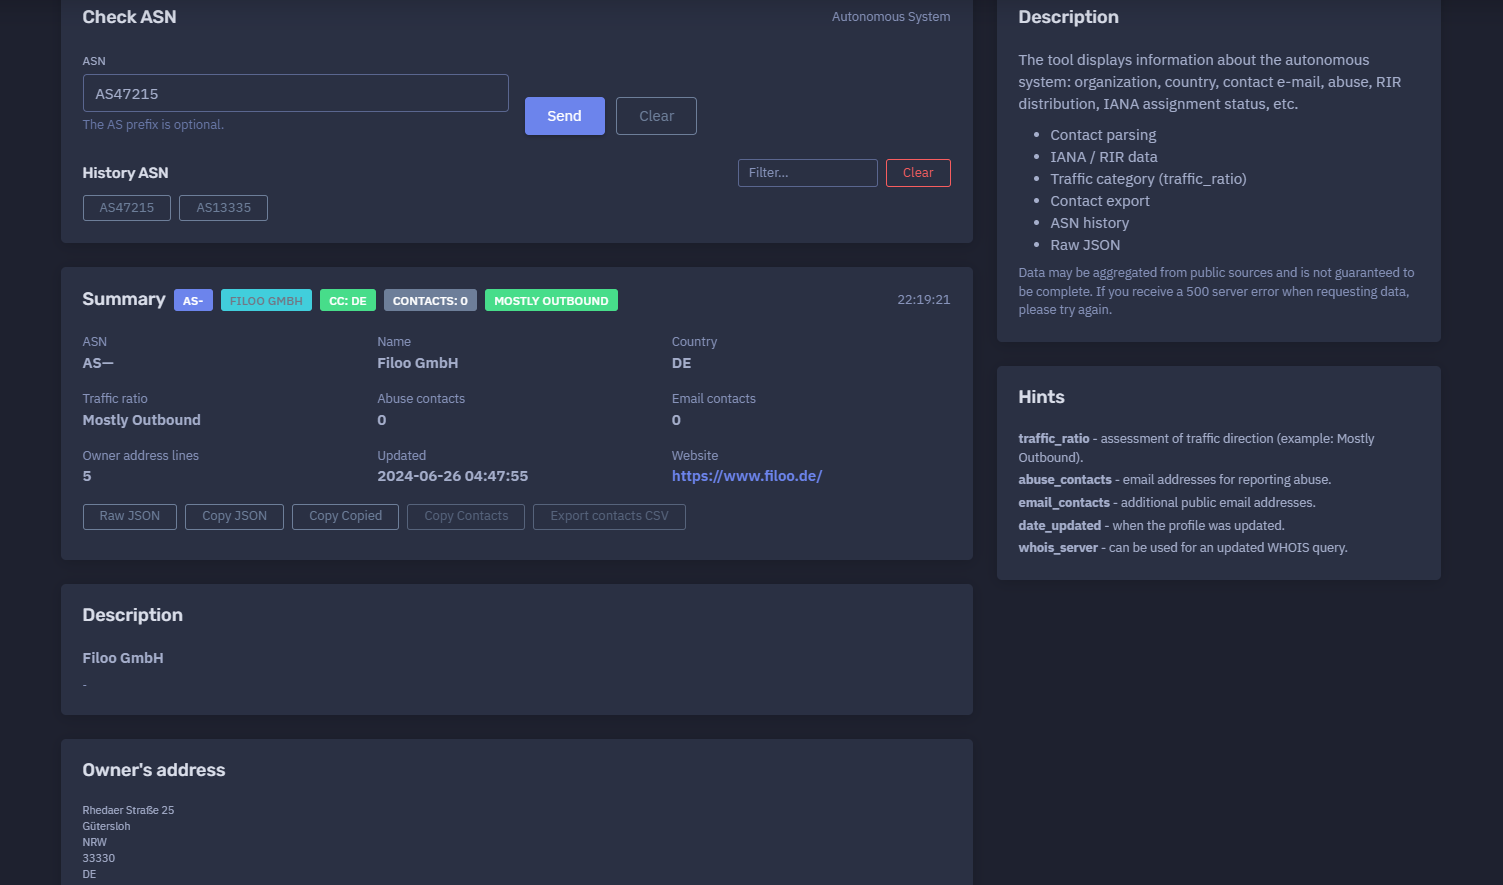
The platform available at https://dash.niamonx.io/asnchecked — known as ASN Information — is an autonomous system intelligence tool within the NiamonX platform. It allows users to check detailed public information about an Autonomous System Number, including organization profile, country, routing scope, traffic category, IPv4 and IPv6 prefix counts, contact information, abuse contacts, RIR status, owner address, policies, website, and raw ASN metadata.
Overview of the Service
ASN Information is designed to help analysts, network engineers, SOC teams, infrastructure owners, cybersecurity researchers, and OSINT specialists quickly understand the public profile of an Autonomous System.
An Autonomous System, or AS, is a network or group of networks operated under a single routing policy on the Internet. Each AS is identified by an ASN, such as:
AS13335
or:
47215
The tool accepts ASN values with or without the AS prefix and returns a structured report containing routing, ownership, policy, contact, traffic, and organization information.
ASN Information is useful for network attribution, abuse reporting, infrastructure mapping, threat intelligence enrichment, routing analysis, vendor review, hosting-provider identification, and incident response.
🔍 How the Tool Works
When a user enters an ASN, the tool queries public and internal intelligence sources and returns the available ASN profile.
The result may include:
-
ASN number
-
Organization name
-
Country code
-
Traffic ratio
-
Traffic volume category
-
Network type
-
IPv4 prefix count
-
IPv6 prefix count
-
Routing scope
-
RIR status
-
Last updated date
-
Abuse contacts
-
General email contacts
-
Website
-
Owner address
-
Peering policy
-
IRR AS-SET
-
Route server information
-
Looking glass information
-
Social media or website links
-
Associated prefixes
-
Raw JSON
Data may be aggregated from public routing, RIR, IANA, peering, WHOIS, and organization sources. Because ASN data can come from multiple public datasets, it should be treated as intelligence context and validated before critical decisions.
🧩 What Can Be Checked
ASN Information accepts Autonomous System Numbers.
Supported input examples:
AS47215
47215
The AS prefix is optional.
Unsupported input examples:
example.com
1.1.1.1
https://example.com
AS47215/example
For IP addresses, domains, ports, or service-level intelligence, users should use the relevant NiamonX IP or DNS modules.
⚙️ Interface Structure
The ASN Information interface contains several main areas.
ASN Input
The user enters an Autonomous System Number.
Example:
AS47215
The tool normalizes the value and performs the lookup.
History ASN
The interface includes ASN history stored locally in the browser. This allows users to quickly repeat previous ASN checks.
Summary
The summary card shows the most important ASN profile fields.
ASN Info
The ASN Info section displays technical routing, policy, and network metadata.
Organization
The Organization section displays owner-related information such as name, address, country, website, and public organization metadata.
Prefixes
The Prefixes section lists IPv4 and IPv6 ranges associated with the ASN when available.
Raw JSON
Raw JSON provides the structured technical response for advanced analysis and integrations.
📊 Summary Section
The summary section gives a fast overview of the ASN.
Typical fields include:
| Field | Description |
|---|---|
| ASN | Autonomous System Number |
| Name | Organization or network name |
| Country | Country code associated with the ASN |
| Traffic ratio | Estimated traffic direction profile |
| Abuse contacts | Number of abuse contact emails |
| Email contacts | Number of general public email contacts |
| Owner address lines | Number of owner address lines available |
| Updated | Last profile update timestamp |
| Website | Official website, if available |
| Description | Short organization or ASN description |
Example summary format:
ASN: AS47215
Name: Example Network GmbH
Country: DE
Traffic ratio: Mostly Outbound
Abuse contacts: 0
Email contacts: 0
Updated: 2024-06-26 04:47:55
Website: https://example.com/
This section is useful for quick triage before reviewing the full technical profile.
🏢 Organization Information
The Organization section displays the entity associated with the ASN.
Possible fields include:
| Field | Description |
|---|---|
| Name | Organization name |
| Name long | Extended organization name, if available |
| AKA | Alternative names |
| Address | Owner address lines |
| City | Organization city |
| State | State or region |
| Zipcode | Postal code |
| Country | Country code |
| Website | Organization website |
| Social media | Public organization links |
| Notes | Additional public notes |
| Status | Organization status |
The owner address can help analysts understand the legal or operational entity behind the ASN. However, organization address data may be incomplete, outdated, or formatted differently depending on the source.
🌐 ASN Info Section
The ASN Info section contains technical and routing-related metadata.
Possible fields include:
| Field | Description |
|---|---|
info_ipv6 |
Whether IPv6 information is available |
info_multicast |
Whether multicast is indicated |
info_unicast |
Whether unicast routing is indicated |
info_prefixes4 |
Number of IPv4 prefixes |
info_prefixes6 |
Number of IPv6 prefixes |
info_ratio |
Traffic direction category |
info_scope |
Geographic or routing scope |
info_traffic |
Approximate traffic category |
info_types |
Network type labels |
irr_as_set |
IRR AS-SET value |
policy_general |
General peering policy |
policy_locations |
Peering location requirement |
policy_contracts |
Contract requirement |
policy_ratio |
Ratio policy indicator |
policy_url |
Policy URL, if available |
rir_status |
RIR status |
rir_status_updated |
Last RIR status update |
route_server |
Route server information |
looking_glass |
Looking glass URL, if available |
website |
Website URL |
This information helps users understand how the ASN participates in Internet routing, peering, traffic exchange, and prefix advertisement.
🛣️ Prefixes
The Prefixes section lists network ranges associated with the ASN.
Example format:
109.75.176.0/20
141.101.32.0/21
185.13.210.0/23
185.134.240.0/24
Prefixes are useful for:
-
Network attribution
-
Firewall rules
-
Threat intelligence enrichment
-
Asset mapping
-
Provider analysis
-
Routing review
-
Incident response
-
Abuse reporting
-
Infrastructure monitoring
Important: prefix lists can change over time. Always validate current route announcements with routing tools, RIR data, or BGP sources when making operational decisions.
📡 IPv4 and IPv6 Support Indicators
ASN Information may show whether IPv4 and IPv6 routing data is available.
Example fields:
info_prefixes4: 30
info_prefixes6: 5
info_ipv6: true
IPv4 Prefix Count
Shows how many IPv4 prefixes are associated with the ASN in the returned profile.
IPv6 Prefix Count
Shows how many IPv6 prefixes are associated with the ASN in the returned profile.
IPv6 Indicator
Shows whether the ASN has IPv6-related information or support in the returned dataset.
These fields are useful for understanding the network’s routing footprint and protocol support.
📈 Traffic Ratio
The traffic_ratio or info_ratio field describes the estimated direction of network traffic.
Example:
Mostly Outbound
Possible categories may include:
-
Mostly Outbound
-
Mostly Inbound
-
Balanced
-
Heavy Outbound
-
Heavy Inbound
-
Unknown
This value is an assessment and should be treated as a routing or peering profile indicator, not as a precise measurement.
Interpretation
A Mostly Outbound network may primarily send more traffic than it receives. This can be common for hosting providers, content providers, certain infrastructure operators, or networks serving outbound-heavy workloads.
A Mostly Inbound network may receive more traffic, which can be common for access networks, eyeball networks, or consumer ISPs.
🌍 Scope and Traffic Category
The tool may show routing scope and traffic volume category.
Example fields:
info_scope: Europe
info_traffic: 1-5Gbps
Scope
Indicates the likely geographic or operational scope of the network.
Examples:
-
Europe
-
North America
-
Global
-
Regional
-
Unknown
Traffic Category
Shows approximate traffic volume category.
Examples:
-
100Mbps-1Gbps
-
1-5Gbps
-
5-10Gbps
-
10-20Gbps
-
20Gbps+
-
Unknown
These fields are estimates and should not be interpreted as guaranteed real-time bandwidth measurements.
🧾 Contacts
ASN Information may display contact counts and contact-related fields.
Important contact types:
| Contact Type | Description |
|---|---|
| Abuse contacts | Email addresses for abuse reporting |
| Email contacts | General public contact emails |
| Contact export | Exportable contact information when available |
Abuse Contacts
abuse_contacts are used to report abuse such as spam, phishing, malware, scanning, botnet traffic, or other malicious activity.
Example use cases:
-
Reporting malicious traffic
-
Submitting phishing complaints
-
Notifying a network operator about compromised systems
-
Escalating security incidents
-
Abuse desk routing
Email Contacts
email_contacts may include additional public email addresses for administrative or technical communication.
Contact data may be incomplete or missing depending on the source.
🏛️ IANA and RIR Data
The tool may include IANA and RIR-related fields.
Possible data includes:
-
RIR status
-
RIR status update date
-
IANA assignment status
-
WHOIS-related source fields
-
whois_serverwhen available
RIR Status
The RIR status indicates whether the ASN profile appears valid or active in the returned registry data.
Example:
rir_status: ok
rir_status_updated: 2024-06-26 04:47:55
Regional Internet Registries include organizations such as RIPE NCC, ARIN, APNIC, LACNIC, and AFRINIC.
This data is important for attribution, validation, and abuse-reporting workflows.
🤝 Peering and Routing Policy
The ASN profile may include policy-related fields.
Possible fields:
| Field | Description |
|---|---|
policy_general |
General peering policy |
policy_locations |
Peering location requirements |
policy_contracts |
Contract requirements |
policy_ratio |
Whether traffic ratio is considered in policy |
policy_url |
URL to public peering policy |
irr_as_set |
IRR AS-SET for routing policy |
route_server |
Route server participation |
looking_glass |
Looking glass system, if available |
Example:
policy_general: Open
policy_contracts: Not Required
irr_as_set: AS-FILOO
These fields are useful for peering research, network operations, IX participation analysis, and BGP routing review.
🔎 IRR AS-SET
An IRR AS-SET is a routing registry object that groups ASNs or routes for routing policy purposes.
Example:
AS-FILOO
IRR AS-SET values are useful for:
-
Route filtering
-
Peering configuration
-
BGP policy review
-
Network operations
-
Prefix validation
-
Transit and peering analysis
IRR data should be validated because registry objects can become outdated.
🔭 Looking Glass
A looking glass is a public network diagnostic tool offered by some network operators.
It may allow users to check:
-
BGP routes
-
Ping results
-
Traceroute results
-
Route server visibility
-
Peering paths
If a looking glass URL is available, the ASN Information tool may show it in the profile.
If it is not available, the field may show:
—
🧬 Raw JSON
The tool provides Raw JSON for advanced analysis.
Raw JSON may include:
-
ASN profile
-
Organization data
-
Prefix list
-
Contact data
-
Policy fields
-
Peering metadata
-
RIR status
-
Website and social links
-
Routing scope
-
Traffic category
-
Internal status fields
Raw JSON is useful for:
-
SOC workflows
-
API-style integrations
-
Case management
-
Evidence preservation
-
Automated enrichment
-
Network inventory systems
-
BGP research
-
Compliance reporting
Raw data should be handled carefully when used in investigations or internal reports.
🕓 ASN History
The tool stores ASN lookup history locally in the browser.
History entries may include:
-
ASN value
-
Organization name
-
Country
-
Lookup timestamp
-
Summary fields
Local history helps users repeat previous ASN checks and compare recent lookups.
Because it is stored locally, it may be cleared when the user clears browser data, switches devices, or uses a different browser profile.
🧠 Key Features
ASN Lookup
Checks Autonomous System information by ASN.
Optional AS Prefix
Accepts ASN values with or without the AS prefix.
Organization Profile
Displays organization name, website, address, country, and related fields.
Country and Scope
Shows country code and routing scope.
Traffic Ratio
Displays estimated traffic direction, such as Mostly Outbound.
Prefix Overview
Shows IPv4 and IPv6 prefix counts and prefix lists.
Contact Parsing
Displays abuse contact counts and public email contact counts when available.
IANA / RIR Data
Includes registry status and update timestamps.
Policy Metadata
Shows peering and routing policy fields where available.
IRR AS-SET
Displays routing registry AS-SET information.
Contact Export
Supports contact export when contact data is available.
Raw JSON
Provides structured technical output for advanced workflows.
ASN History
Stores recent ASN checks locally in the browser.
🔍 Common Use Cases
ASN Information can support many technical and security workflows.
Network Attribution
Identify which organization operates an ASN.
Abuse Reporting
Find abuse contacts or organization information for reporting malicious traffic.
Threat Intelligence
Enrich suspicious IPs by mapping them to ASN ownership and prefix ranges.
SOC Triage
Quickly understand whether an alert involves hosting, access, cloud, or network service provider infrastructure.
BGP and Routing Research
Review prefixes, AS-SET, scope, policy, and traffic ratio.
Vendor and Provider Review
Understand network providers, hosting companies, and traffic profiles.
Infrastructure Mapping
Identify IP ranges associated with an organization.
Compliance and Risk Review
Document ASN ownership and routing metadata for audit workflows.
Incident Response
Determine who to contact and which prefixes may be related to an incident.
⚠️ Result Interpretation Notes
ASN data should be interpreted carefully.
Important points:
-
Public ASN data may be incomplete.
-
Contact fields may be missing or outdated.
-
Prefix lists may change over time.
-
Traffic categories are estimates.
-
RIR status does not guarantee current operational behavior.
-
WHOIS and registry data may differ from real-world operations.
-
ASNs can be used by hosting providers, enterprises, ISPs, CDNs, or transit networks.
-
A malicious IP inside an ASN does not mean the ASN owner is malicious.
-
Abuse contacts may be absent even for active networks.
-
Always validate important findings with live BGP, WHOIS, RIR, and provider sources.
If a server-side 500 error occurs during lookup, repeat the request.
✅ Recommended Analyst Workflow
A practical ASN investigation should follow these steps.
1. Enter the ASN
Use either AS47215 or 47215.
2. Review the Summary
Check organization name, country, traffic ratio, contacts, update date, and website.
3. Check Contact Data
Look for abuse contacts and public email contacts.
4. Review Organization Details
Check address, country, website, and status.
5. Review ASN Info
Inspect IPv4 / IPv6 support, prefix counts, traffic category, routing scope, network type, and policy fields.
6. Review Prefixes
Use prefix lists for mapping, filtering, or threat intelligence enrichment.
7. Check RIR Status
Review registry status and update timestamp.
8. Use Raw JSON
Open Raw JSON for deeper technical workflows or export.
9. Correlate With Other Tools
Use IP lookup, reverse IP, DNS, BGP, WHOIS, and vulnerability tools for deeper analysis.
10. Validate Before Action
Confirm important conclusions before contacting providers, blocking ranges, or publishing reports.
🛡️ Security, Privacy & Responsible Use
ASN Information is intended for lawful network intelligence, security analysis, routing research, abuse reporting, and infrastructure review.
Acceptable use cases include:
-
Checking public ASN information
-
Identifying network ownership
-
Enriching IP intelligence
-
Finding abuse contacts
-
Reviewing prefixes
-
Supporting SOC triage
-
Investigating suspicious infrastructure
-
Researching routing policies
-
Documenting provider information
-
Supporting compliance and incident response
Users should follow responsible use principles:
-
Do not harass network operators.
-
Do not assume an ASN owner is responsible for every hosted customer action.
-
Do not block large ASN ranges without careful validation.
-
Do not publish inaccurate attribution based on incomplete data.
-
Validate abuse contacts before escalation.
-
Treat exported data as investigation material.
-
Use the tool only for lawful and ethical analysis.
⚙️ Technical Highlights
-
ASN lookup tool
-
Available at
dash.niamonx.io/asnchecked -
Accepts ASN with or without
ASprefix -
Displays organization profile
-
Shows country code
-
Shows traffic ratio
-
Shows traffic category
-
Shows network scope
-
Shows network type labels
-
Displays IPv4 prefix count
-
Displays IPv6 prefix count
-
Lists associated prefixes
-
Parses abuse contacts
-
Parses public email contacts
-
Includes IANA / RIR data
-
Shows RIR status and update date
-
Displays owner address
-
Shows website and social links
-
Shows peering policy fields
-
Shows IRR AS-SET
-
Shows route server and looking glass fields when available
-
Supports contact export
-
Supports Raw JSON
-
Stores ASN history locally
-
Suitable for SOC, OSINT, routing research, abuse reporting, threat intelligence, and infrastructure mapping
📌 Usage Hints
-
The
ASprefix is optional. -
Use ASN lookup after identifying an IP’s ASN in IP intelligence tools.
-
Check
traffic_ratioto understand traffic direction profile. -
Use
abuse_contactsfor abuse reports when available. -
Use
email_contactsfor additional public contacts. -
Check
date_updatedor RIR update fields to understand profile freshness. -
Use
whois_serverwhen available for updated WHOIS queries. -
Review prefixes before creating firewall or monitoring rules.
-
Validate prefix lists with live BGP when accuracy is critical.
-
Use Raw JSON for deeper analysis and integrations.
-
If a server-side
500error occurs, repeat the request. -
Remember that public ASN data may be incomplete.
📬 Contact Information
For technical, legal, abuse, privacy, or support-related inquiries, users can contact the NiamonX team directly:
support@niamonx.io — Technical Support
other@niamonx.io — General Inquiries
takedown@niamonx.io — Privacy or Data Removal Requests
legal@niamonx.io — Legal and Compliance Matters
Alternative contact channel:
🔗 Helpdesk: https://support.niamonx.io/
Summary
NiamonX ASN Information is an autonomous system intelligence tool for checking public ASN profile data, organization information, routing scope, traffic ratio, prefix lists, abuse contacts, RIR status, peering policy, website, owner address, and Raw JSON.
It is designed for lawful network intelligence, SOC triage, OSINT enrichment, abuse reporting, routing research, infrastructure mapping, compliance, and incident response. Data may be aggregated from public sources and should be validated before critical operational or legal decisions.